ECON 2041
Introductory Econometrics
Intro to unit
Outline
- Salary prediction game
- Technology and learning materials
- Assessment
- Learning outcomes
- Plan for the semester
Teaching team
Unit convenor: Associate Professor Emilia Tjernstrom
Email: emilia.tjernstrom@mq.edu.au
Consultation hours: Tuesdays 9 - 10 (both in-person and Zoom)
Tutors:
Fazeel Jaleel
Syed Atif
Adithya Krishna
Tutorials start in week 2
Yes, I know...
It's a beast!
~churn-strom
Teaching team
Unit convenor: Associate Professor Emilia Tjernstrom
Email: emilia.tjernstrom@mq.edu.au
Consultation hours: Tuesdays 9 - 10 (both in-person and Zoom)
A little more about me:
I study how policies work & for whom
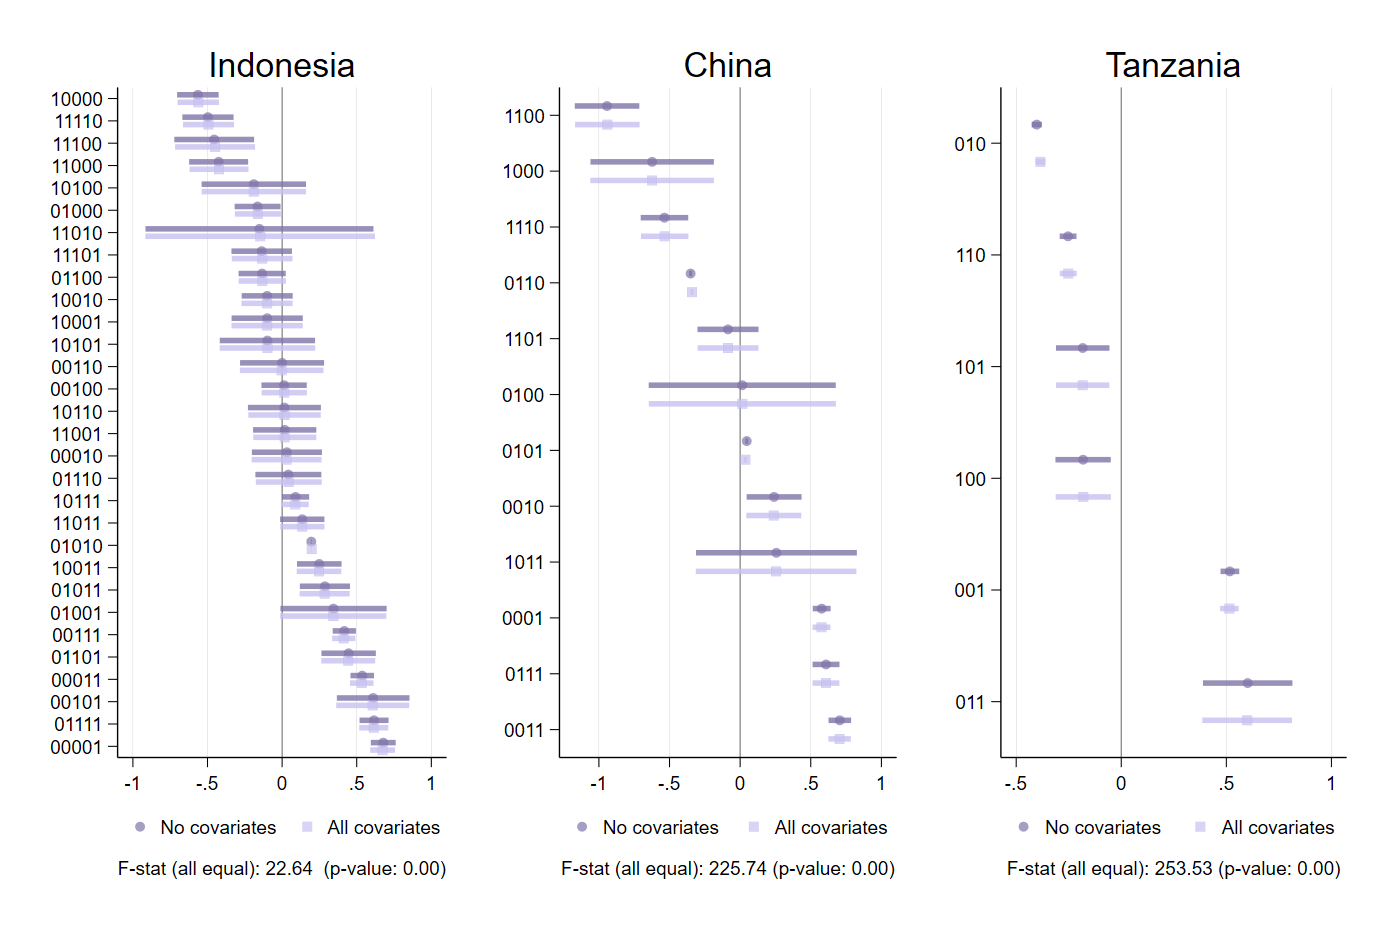
I apply and develop econometric tools to understand treatment effect heterogeneity
Teaching team
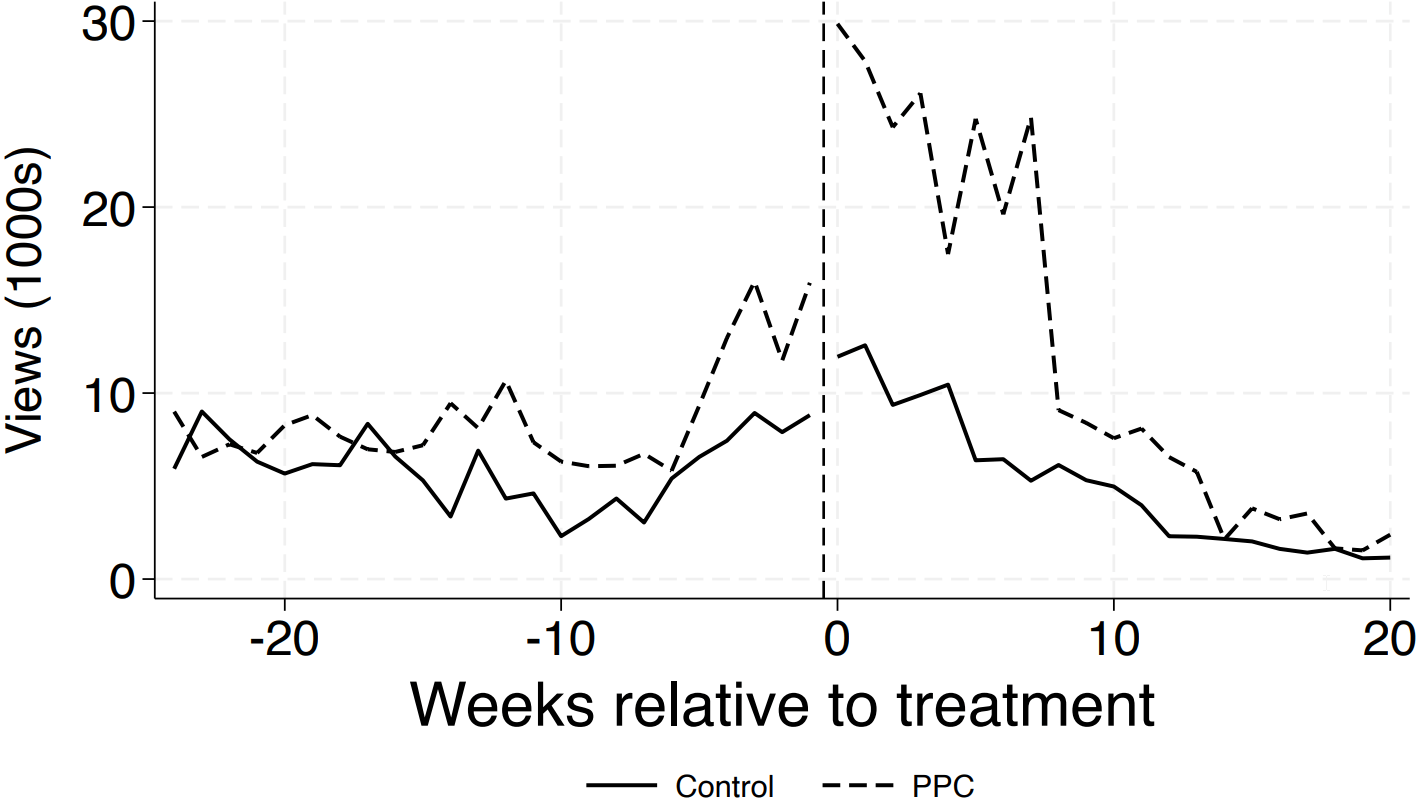
I design & run large-scale RCTs in developing countries
![]()
A little more about me: ![]()
What will you earn when you graduate?
The Graduate Outcomes Survey (GOS)
Where I got the data:
- A national survey of new graduates, run every year since 2016
- In 2025: over 120,000 graduates from 136 institutions, including all 42 Australian unis
- Graduates respond 4--6 months after finishing, so these are first-job salaries
- We will look at the median annual salary of grads working full-time
Remember, the median tells you what the typical new graduate earns, not the average
Salary prediction game
Ten fields of study, guess what you think the typical new graduate earns per year
- Open your portal link (in welcome email)
https://emiliatjernstrom.com/econ2041/portal.html
- OR scan the QR code & enter your code
(happy-koala)
- Move the sliders to your best guess
Portal answers are anonymous & ungraded
Quantitative skills pay
Evidence from Texas: used AI to classify coursework for every public-university student, linked to their quarterly earnings after graduation
- +1 quant course: ca. 1.1% higher early-career earnings, roughly $150 more per quarter
- Writing-focused coursework: no detectable earnings return
- Largest gains where the skills are scarcest:
- 10.6% vs 1.9% for students in less-quantitative majors
- 9.8% vs 4% for URM students (per SD of quant coursework)
This unit is a great place to start building these skills...
By the end, you will have a portfolio of notebooks showing off the skills you've learned!
Source: Xu, Yaling (2026), "Does coursework matter? Uncovering the role of skills in the returns to college," EdWorkingPaper 26-1484
Software
Excel
You can get Excel & other MS Office products through your MQ account
Zoom
- How to use it (remember to test your mic)
- We expect people to have their cameras on when in Zoom meetings
Python
- We'll cover using Python in next week's lecture (in Colab)
- Note: you'll need a google account
Textbook
Introductory Econometrics
(2nd Asia-Pacific ed.)
What is our goal?
a.k.a. demystifying learning outcomes
Learning outcomes
Analyse & apply key statistical concepts:
- probability distributions
- parameters, estimators & sampling distributions
- point & interval estimation
- hypothesis testing
What does this mean in practice?
You should understand the building blocks of statistics as applied to economic questions:
- how we use samples to learn about a bigger group
- how confident we can be in our estimates
- how to tell if a result is real or just random
Learning outcomes
Specify, estimate & interpret a regression model
What does this mean in practice?
You should be able to set up and use regression models to
examine data & models
- explore how one variable (education) affects another (income)
- interpret regression tables (how economists present results)
Learning outcomes
2
![]()
![]()
Specify, estimate & interpret a regression model
Answer: Did it work?
|
(1) |
(2) |
| Enrolled |
295.43*** |
264.90*** |
|
(37.23) |
(85.73) |
| Control group mean |
1128.39 |
1082.38 |
| Observations |
682 |
682 |
Learning outcomes
Summarise and interpret the estimation results, and draw valid inferences using hypothesis tests
What does this mean in practice?
Make sense of your results! Basically, you should know...
- what the numbers mean
- how strong the evidence is
- whether your conclusions are "real" or could be due to chance
Move from output \rightarrow insight
Learning outcomes
Critically evaluate standard regression model assumptions & the consequences of violations
What does this mean in practice?
You should know and understand...
- what can go wrong when the assumptions underlying a regression model don't hold up
- what such violations mean for your results
Learning outcomes
Use econometric software to solve econometric problems
What does this mean in practice?
Use software to run econometric analyses
Build practical skills!
How to do well in ECON2041
Each week, you should...
1 Read the assigned textbook chapter + any other assigned readings
Each week, you should...
1 Read the assigned textbook chapter + any other assigned readings
2 Watch the Essential Concepts videos (the lecture builds on them)
Each week, you should...
1 Read the assigned textbook chapter + any other assigned readings
2 Watch the Essential Concepts videos (the lecture builds on them)
3 Attend the live lecture
Each week, you should...
1 Read the assigned textbook chapter + any other assigned readings
2 Watch the Essential Concepts videos (the lecture builds on them)
3 Attend the live lecture
4 Attempt the tutorial questions
Each week, you should...
1 Read the assigned textbook chapter + any other assigned readings
2 Watch the Essential Concepts videos (the lecture builds on them)
3 Attend the live lecture
4 Attempt the tutorial questions
Each week, you should...
1 Read the assigned textbook chapter + any other assigned readings
2 Watch the Essential Concepts videos (the lecture builds on them)
3 Attend the live lecture
4 Attempt the tutorial questions
6 Begin working on assessments
Each week, you should...
1 Read the assigned textbook chapter + any other assigned readings
2 Watch the Essential Concepts videos (the lecture builds on them)
3 Attend the live lecture
4 Attempt the tutorial questions
6 Begin working on assessments
7 Ask for help if you need it!
Assessment
Checks your grasp of core concepts and skills in applied econometrics, building on work from tutorials
Format: in-person quiz
You'll draw on content from lectures & tutorials to apply econometrics to real problems
Format: short answer written submission
We're building something a little different: think choose-your-own-adventure, with data.
Watch this space!
Format: 2-hour cumulative invigilated on-campus exam, held during Examination Period
Plan for the semester
2 Basic mathematical tools
7 Flavors of OLS & OVB Quiz
10 Inference, continued PS due 16 Oct
12 Measurement error & IRL
Week 1
Essential concepts
- What is econometrics?
- What data do we use in econometrics?
Live lecture
- Intro to unit
- Salary prediction game
Tutorial
No tutorial in week 1
Week 2
Essential concepts
- Summation, proportions, percentages
- Partial derivatives, non-linear functions
Live lecture
- Intro to Python
- Write some code, bring laptops
Tutorial
- Get started with Python
- Understanding data types