ECON 2041

Introductory Econometrics

Income & happiness

Plan for the semester

1 What is econometrics?

2 Basic mathematical tools

3 Stats fundamentals

4 Stats fundamentals II

5 Simple regression

6 OLS properties & fit

7 Flavors of OLS & OVB Quiz

8 Causality

9 Regression inference

10 Inference, continued PS due 16 Oct

11 Diagnostics

12 Measurement error & IRL

13 Revision

Happiness

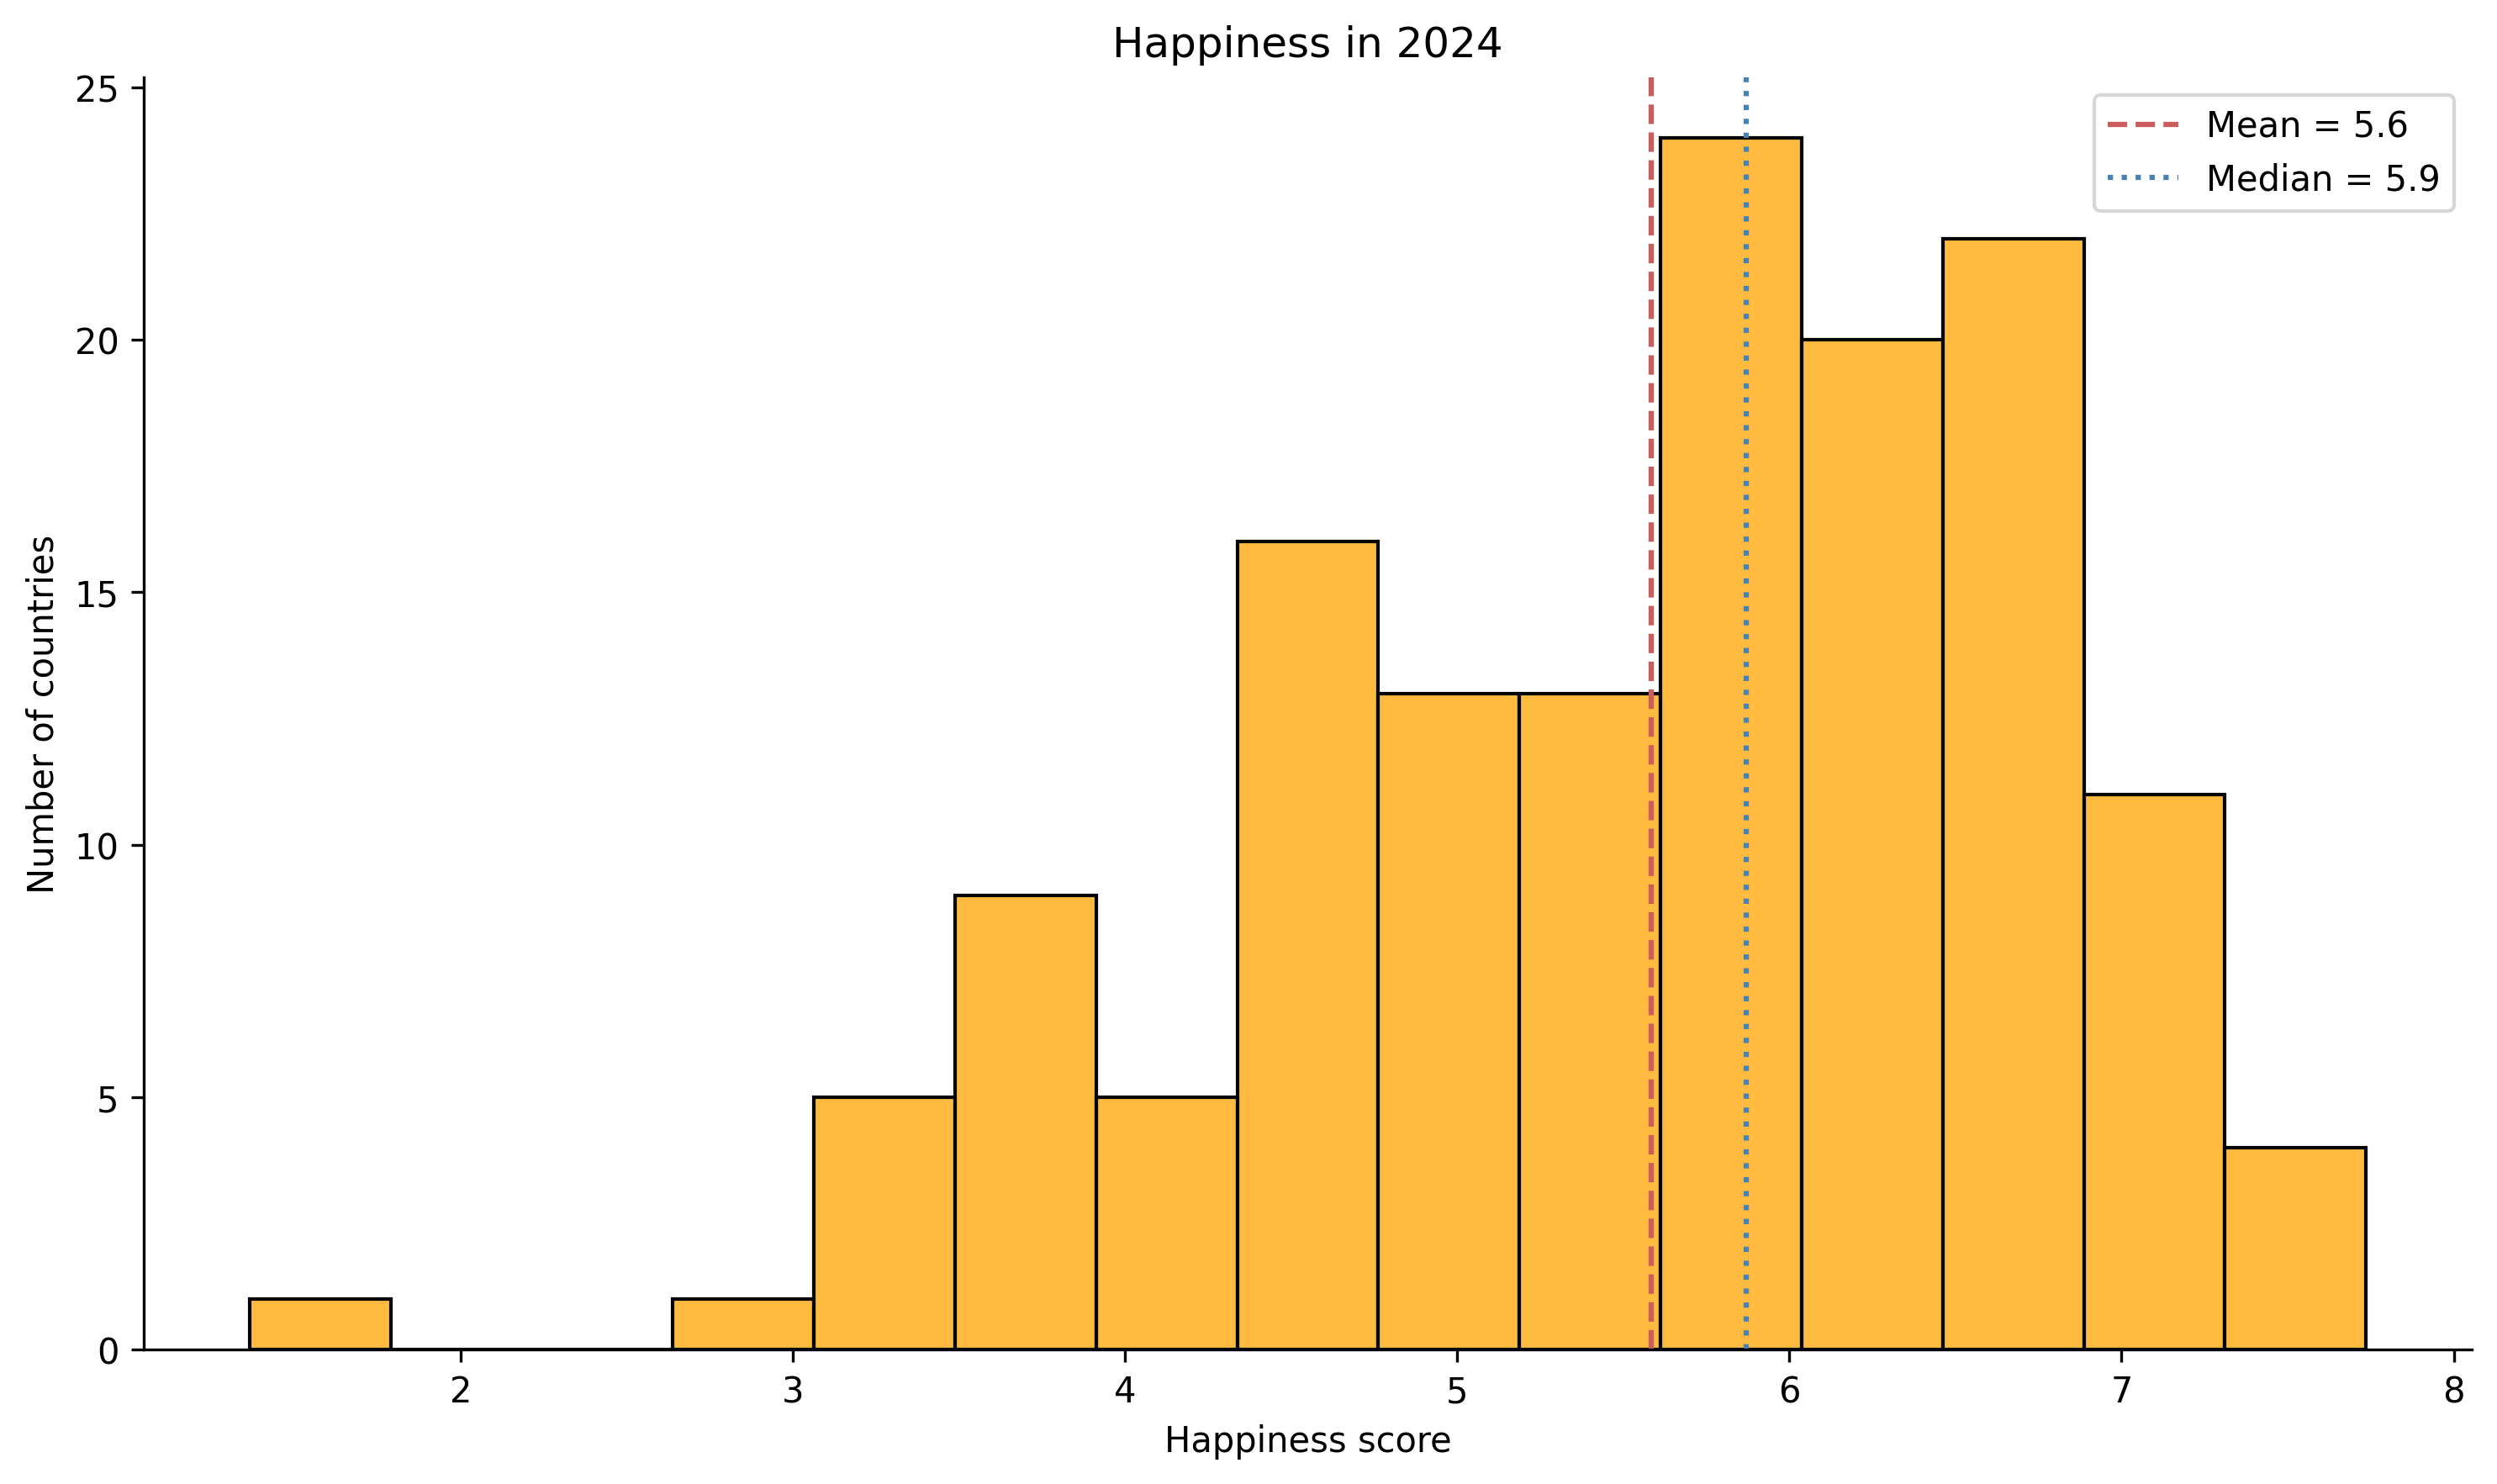
Happiness

Cantril Ladder score

Source: Gallup World Poll

Please imagine a ladder, with steps numbered from 0 at the bottom to 10 at the top. The top of the ladder represents the best possible life for you, and the bottom of the ladder represents the worst possible life for you. On which step of the ladder would you say you personally feel you stand at this time?

GDP per capita

GDP per person, adjusted for inflation and purchasing power


  • Total value added from the production of G&S in country
  • Divided by population
  • PPP-adjusted
  • In "international dollars"
  • Source: World Bank

Cross-sectional data

  • 144 countries in 2024
  • GDP per capita (X) & happiness (Y) are both continuous RVs
  • Why? They're draws from a larger conceptual population


Experiment

  • draw a set of respondents from each country
  • calculate their average life satisfaction


Sample space

  • set of all possible tuples of country averages you could get
  • X maps each outcome of that process to a number

Now let's open the data!

Open this week's lecture notebook and follow along:

https://emiliatjernstrom.com/econ2041/lectures/w03


It will open directly in Colab

Click Copy to Drive first, so you can save any edits

The notebook reproduces every figure in today's slides

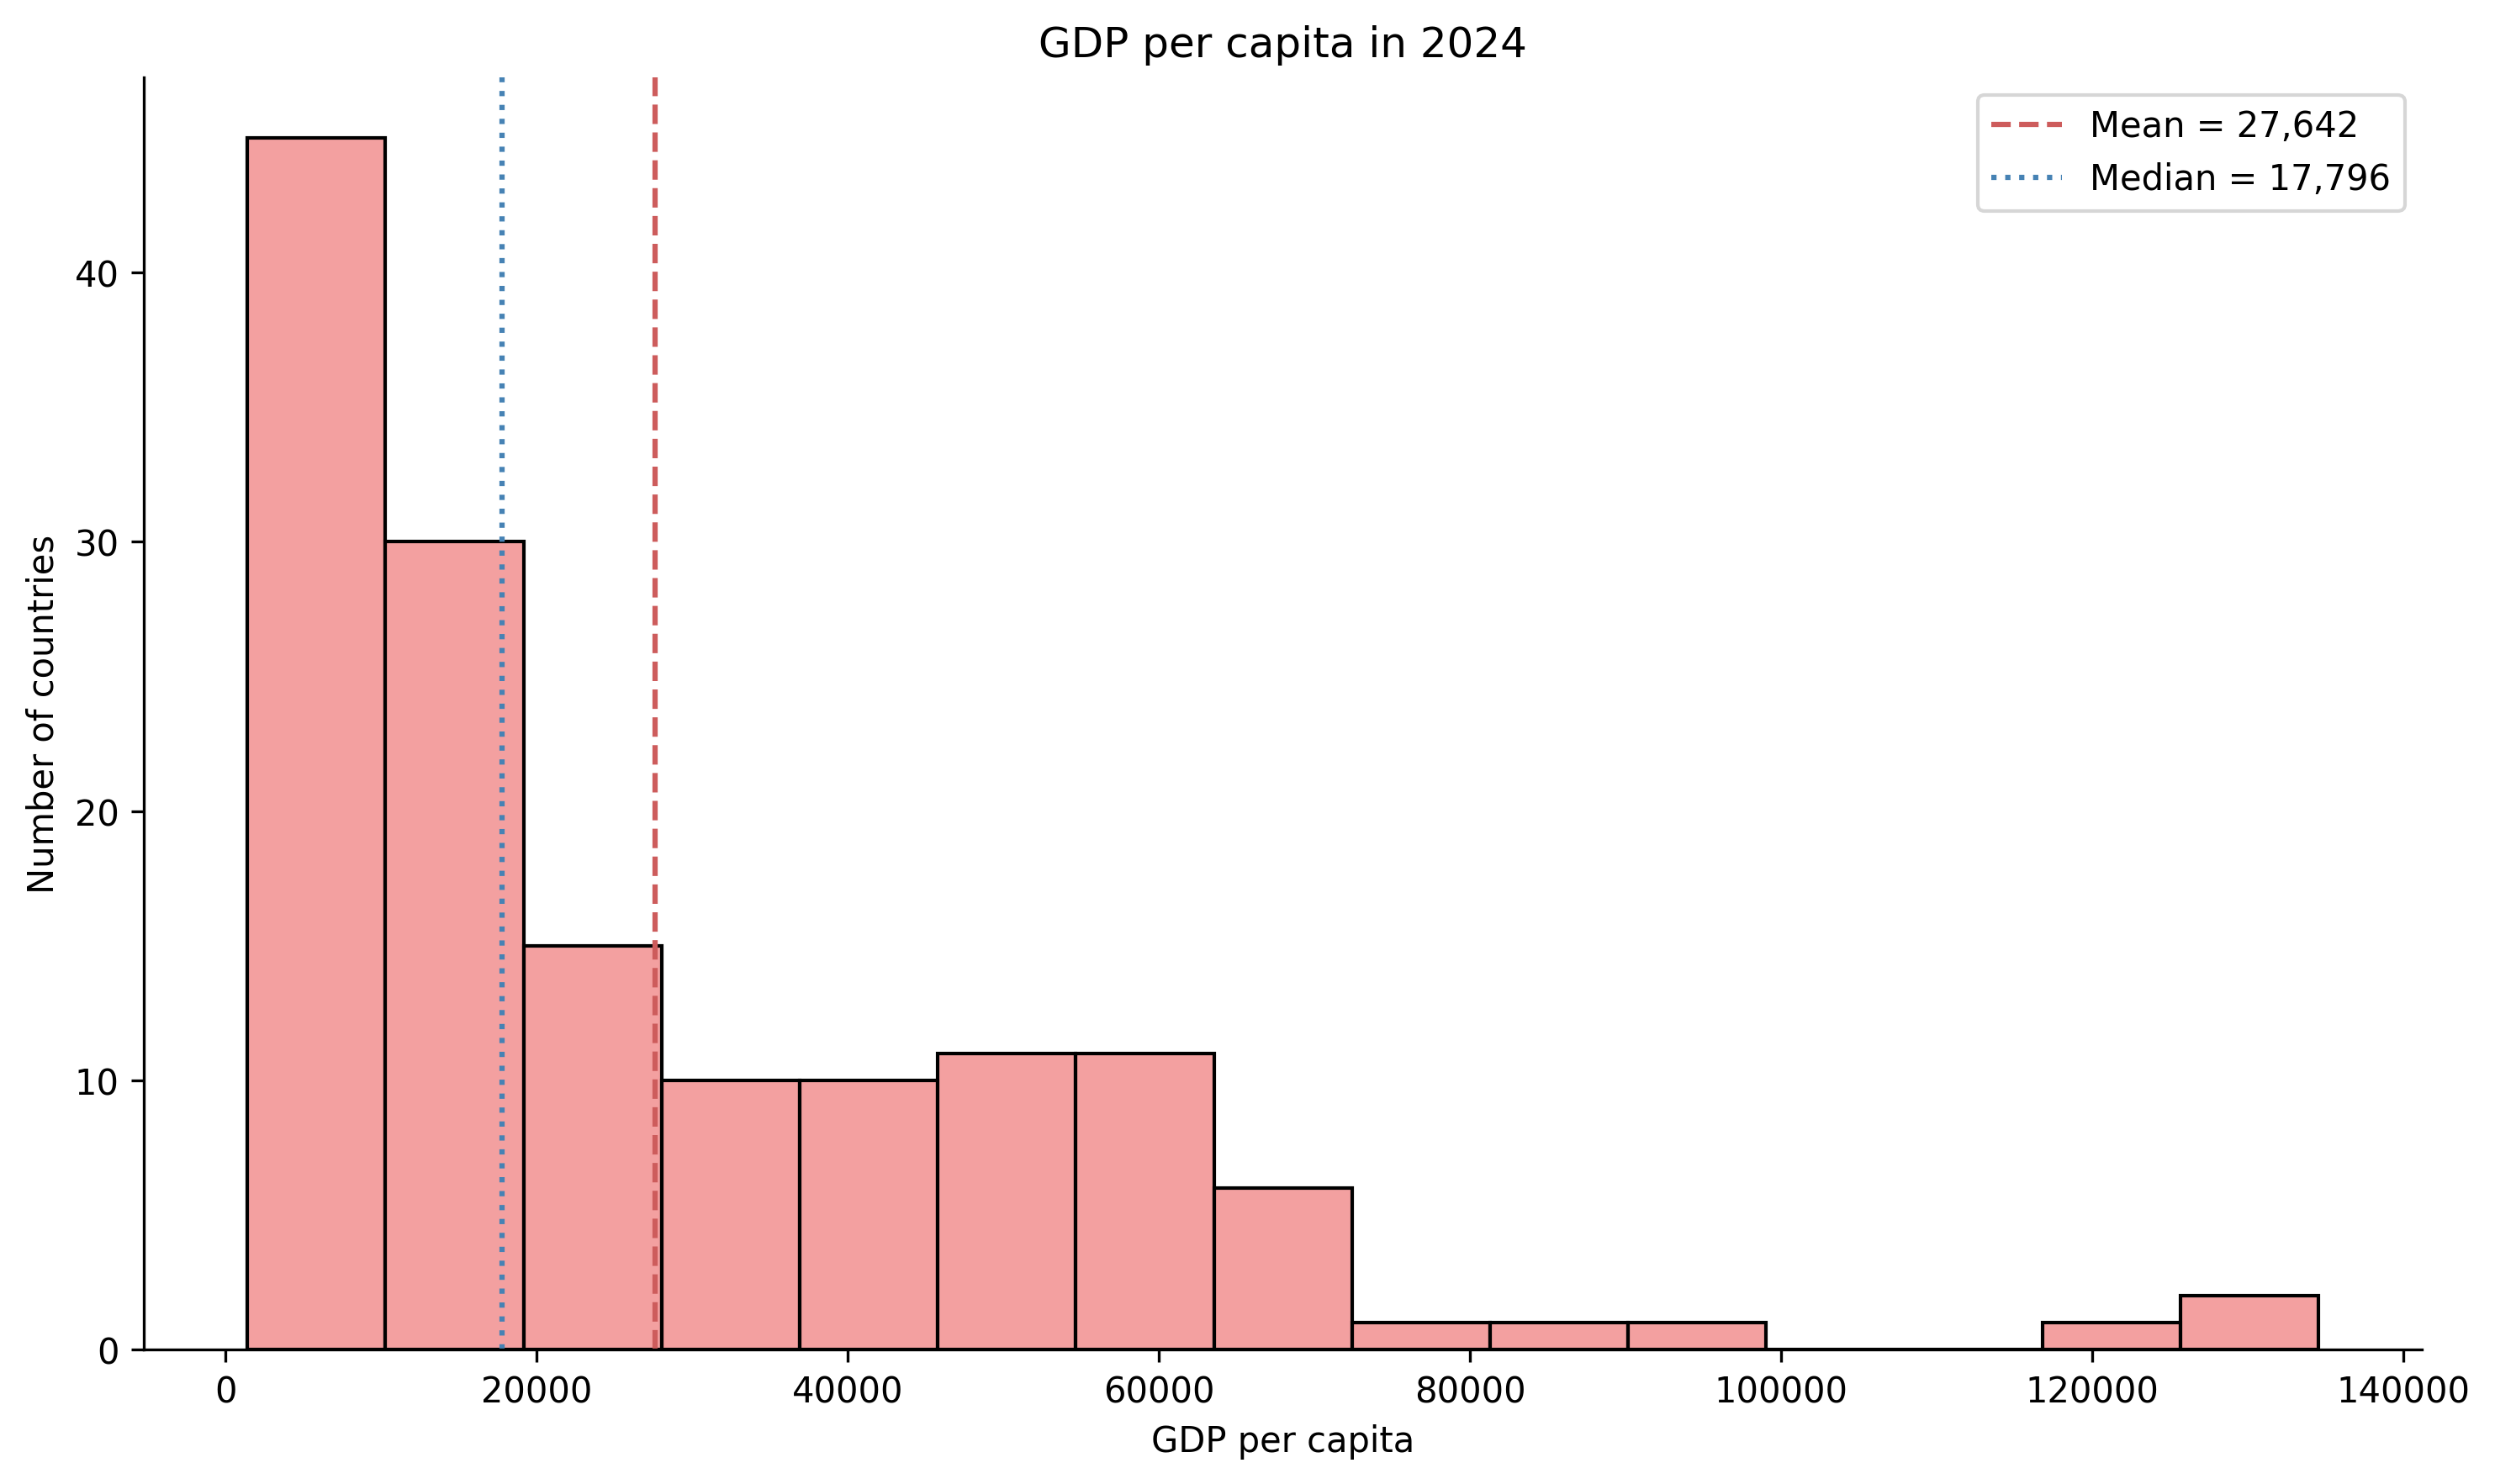
The mean and the median disagree about GDP

happy[['Happiness', 'GDP_pc']].describe()
count mean std min 25% 50% 75% max
Happiness 144 5.58 1.15 1.36 4.71 5.87 6.47 7.74
GDP_pc 144 27,642 26,296 1,409 7,057 17,796 42,378 134,549

Most countries rate between 4 & 7

Data: Gallup World Poll & World Bank, via Our World in Data

GDP per capita is strongly right-skewed

Each picture is one line of code


sns.histplot(happy['GDP_pc'], bins=15)

Happiness, given GDP

\mathbb{E}[\,\text{Happiness} \mid \text{GDP per capita}\,]

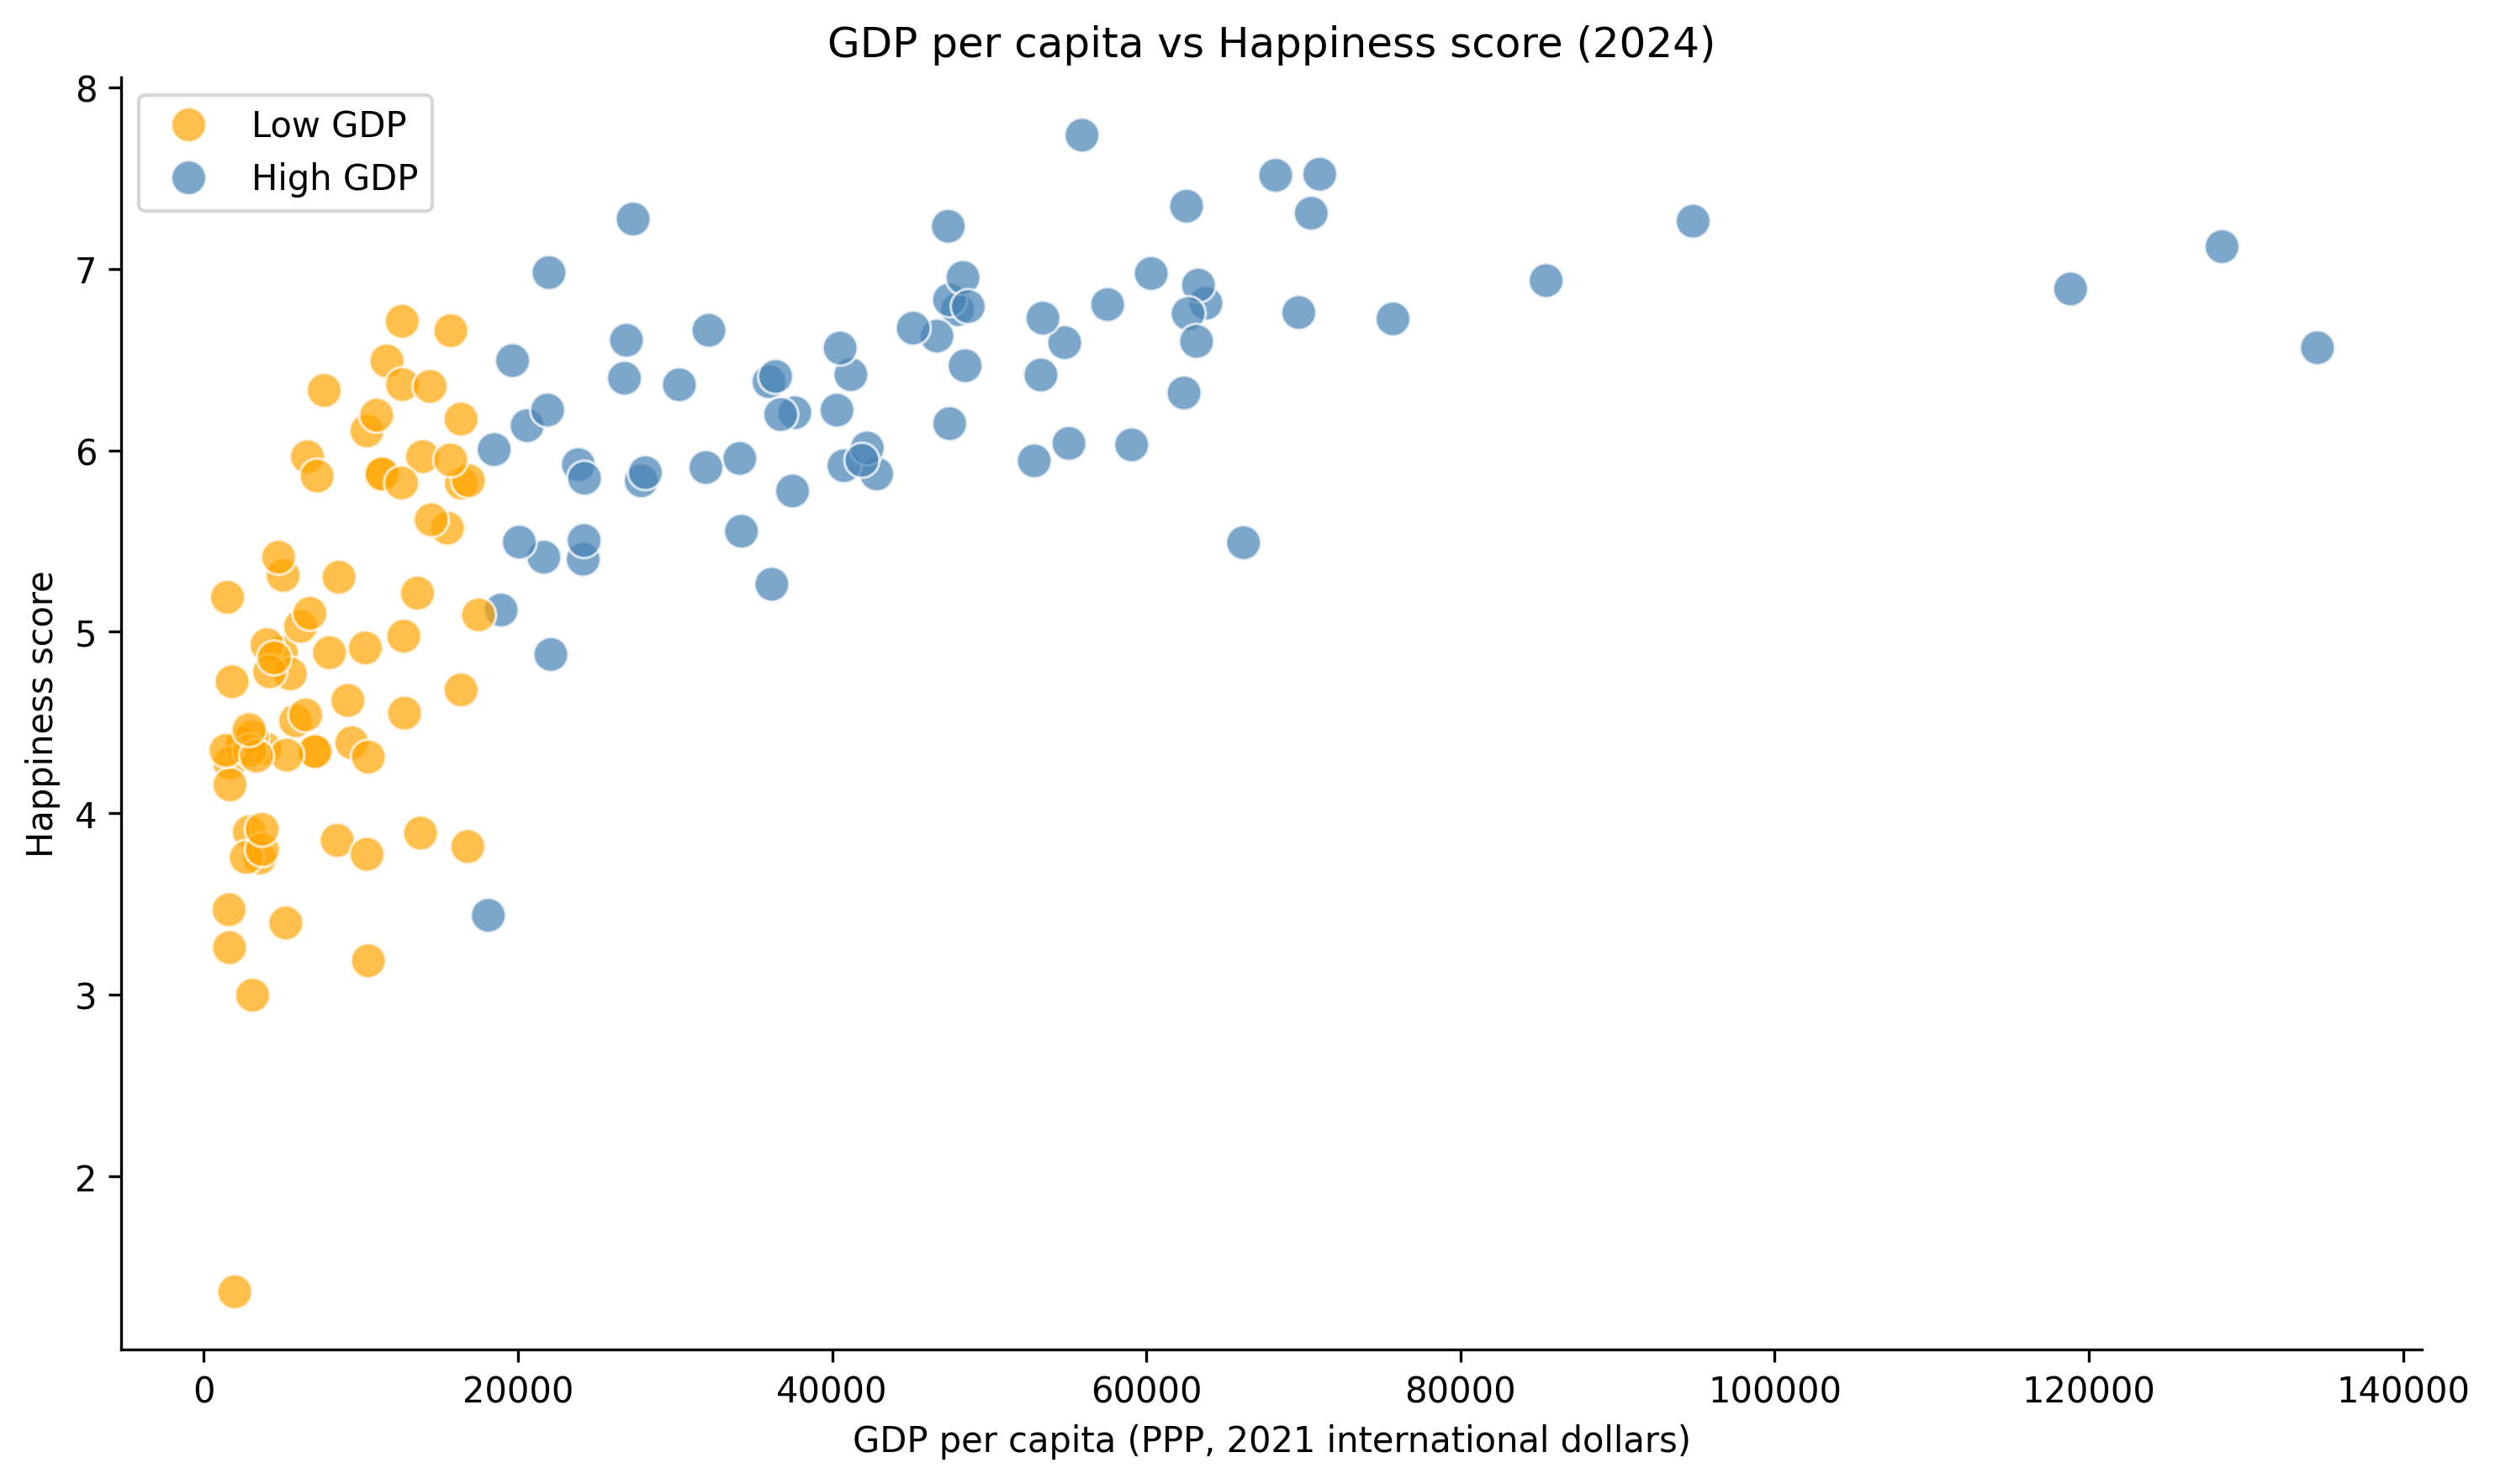
Conditioning is a Boolean

median_gdp = happy['GDP_pc'].median()
mask = happy['GDP_pc'] > median_gdp
Entity GDP_pc mask
Afghanistan 1,964 False
Albania 21,641 True
Algeria 15,502 False
Argentina 26,772 True
Armenia 20,079 True

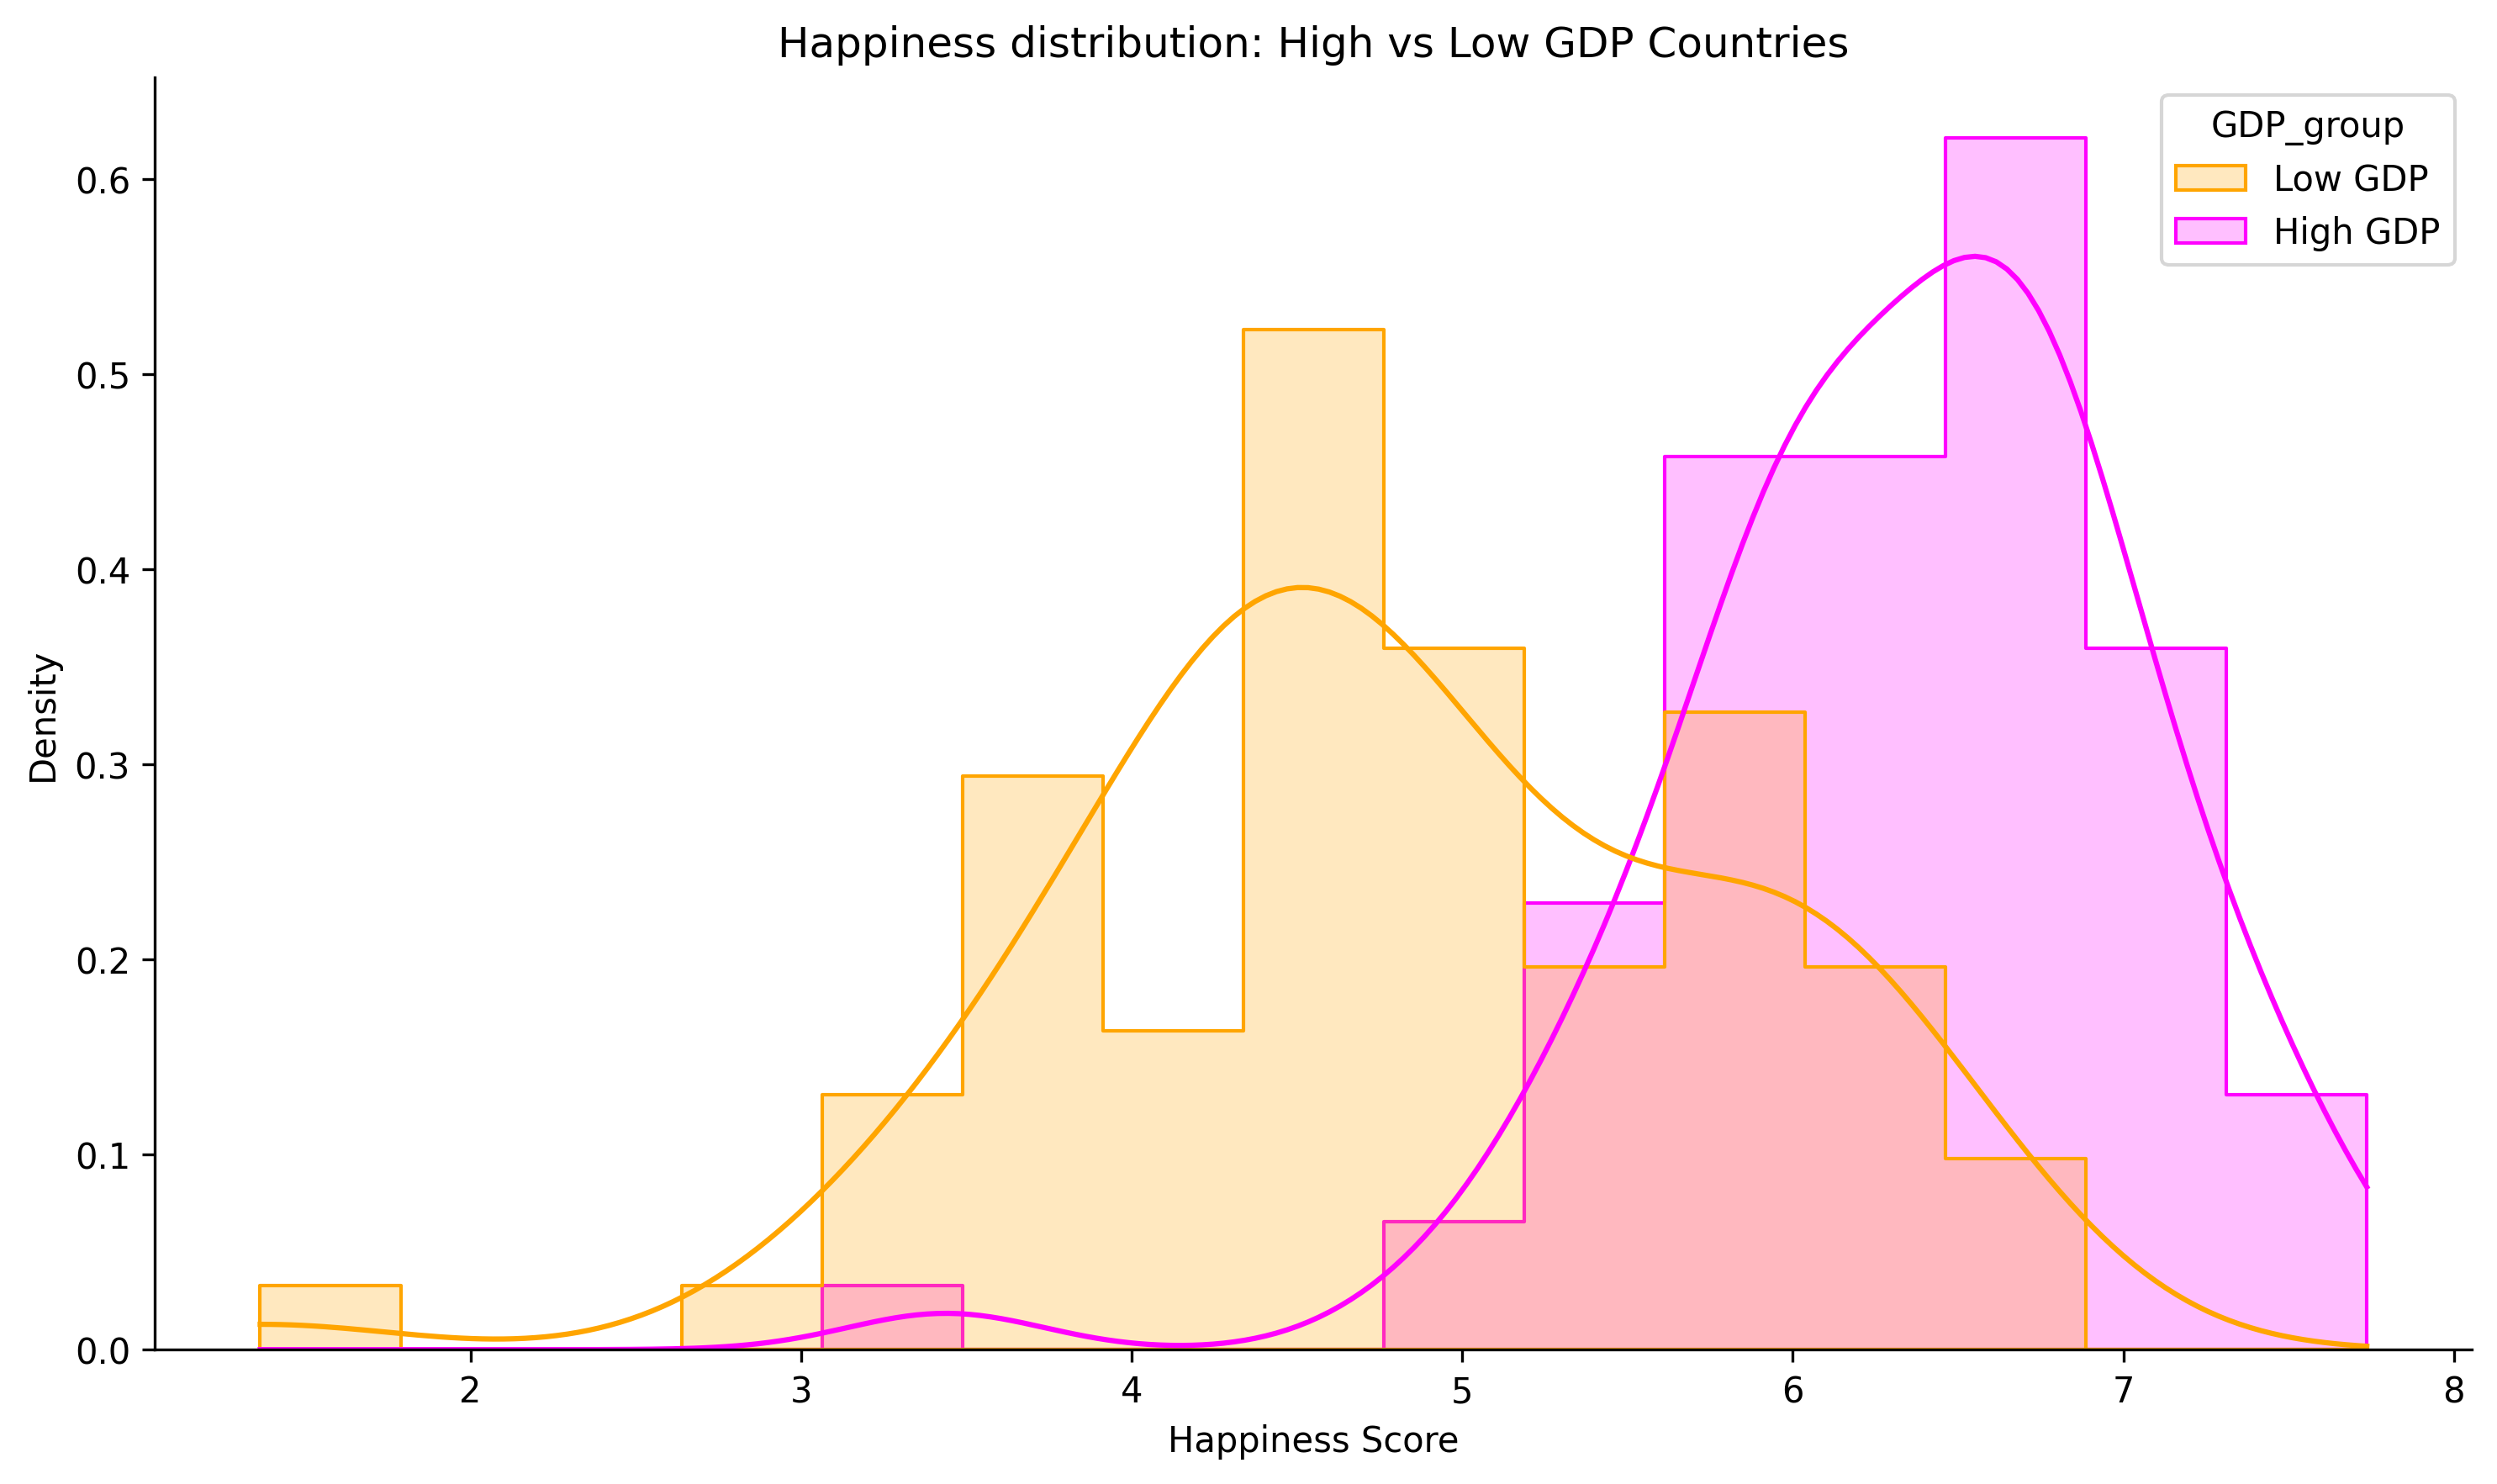
Happiness conditional on GDP

Happiness conditional on GDP: independent?

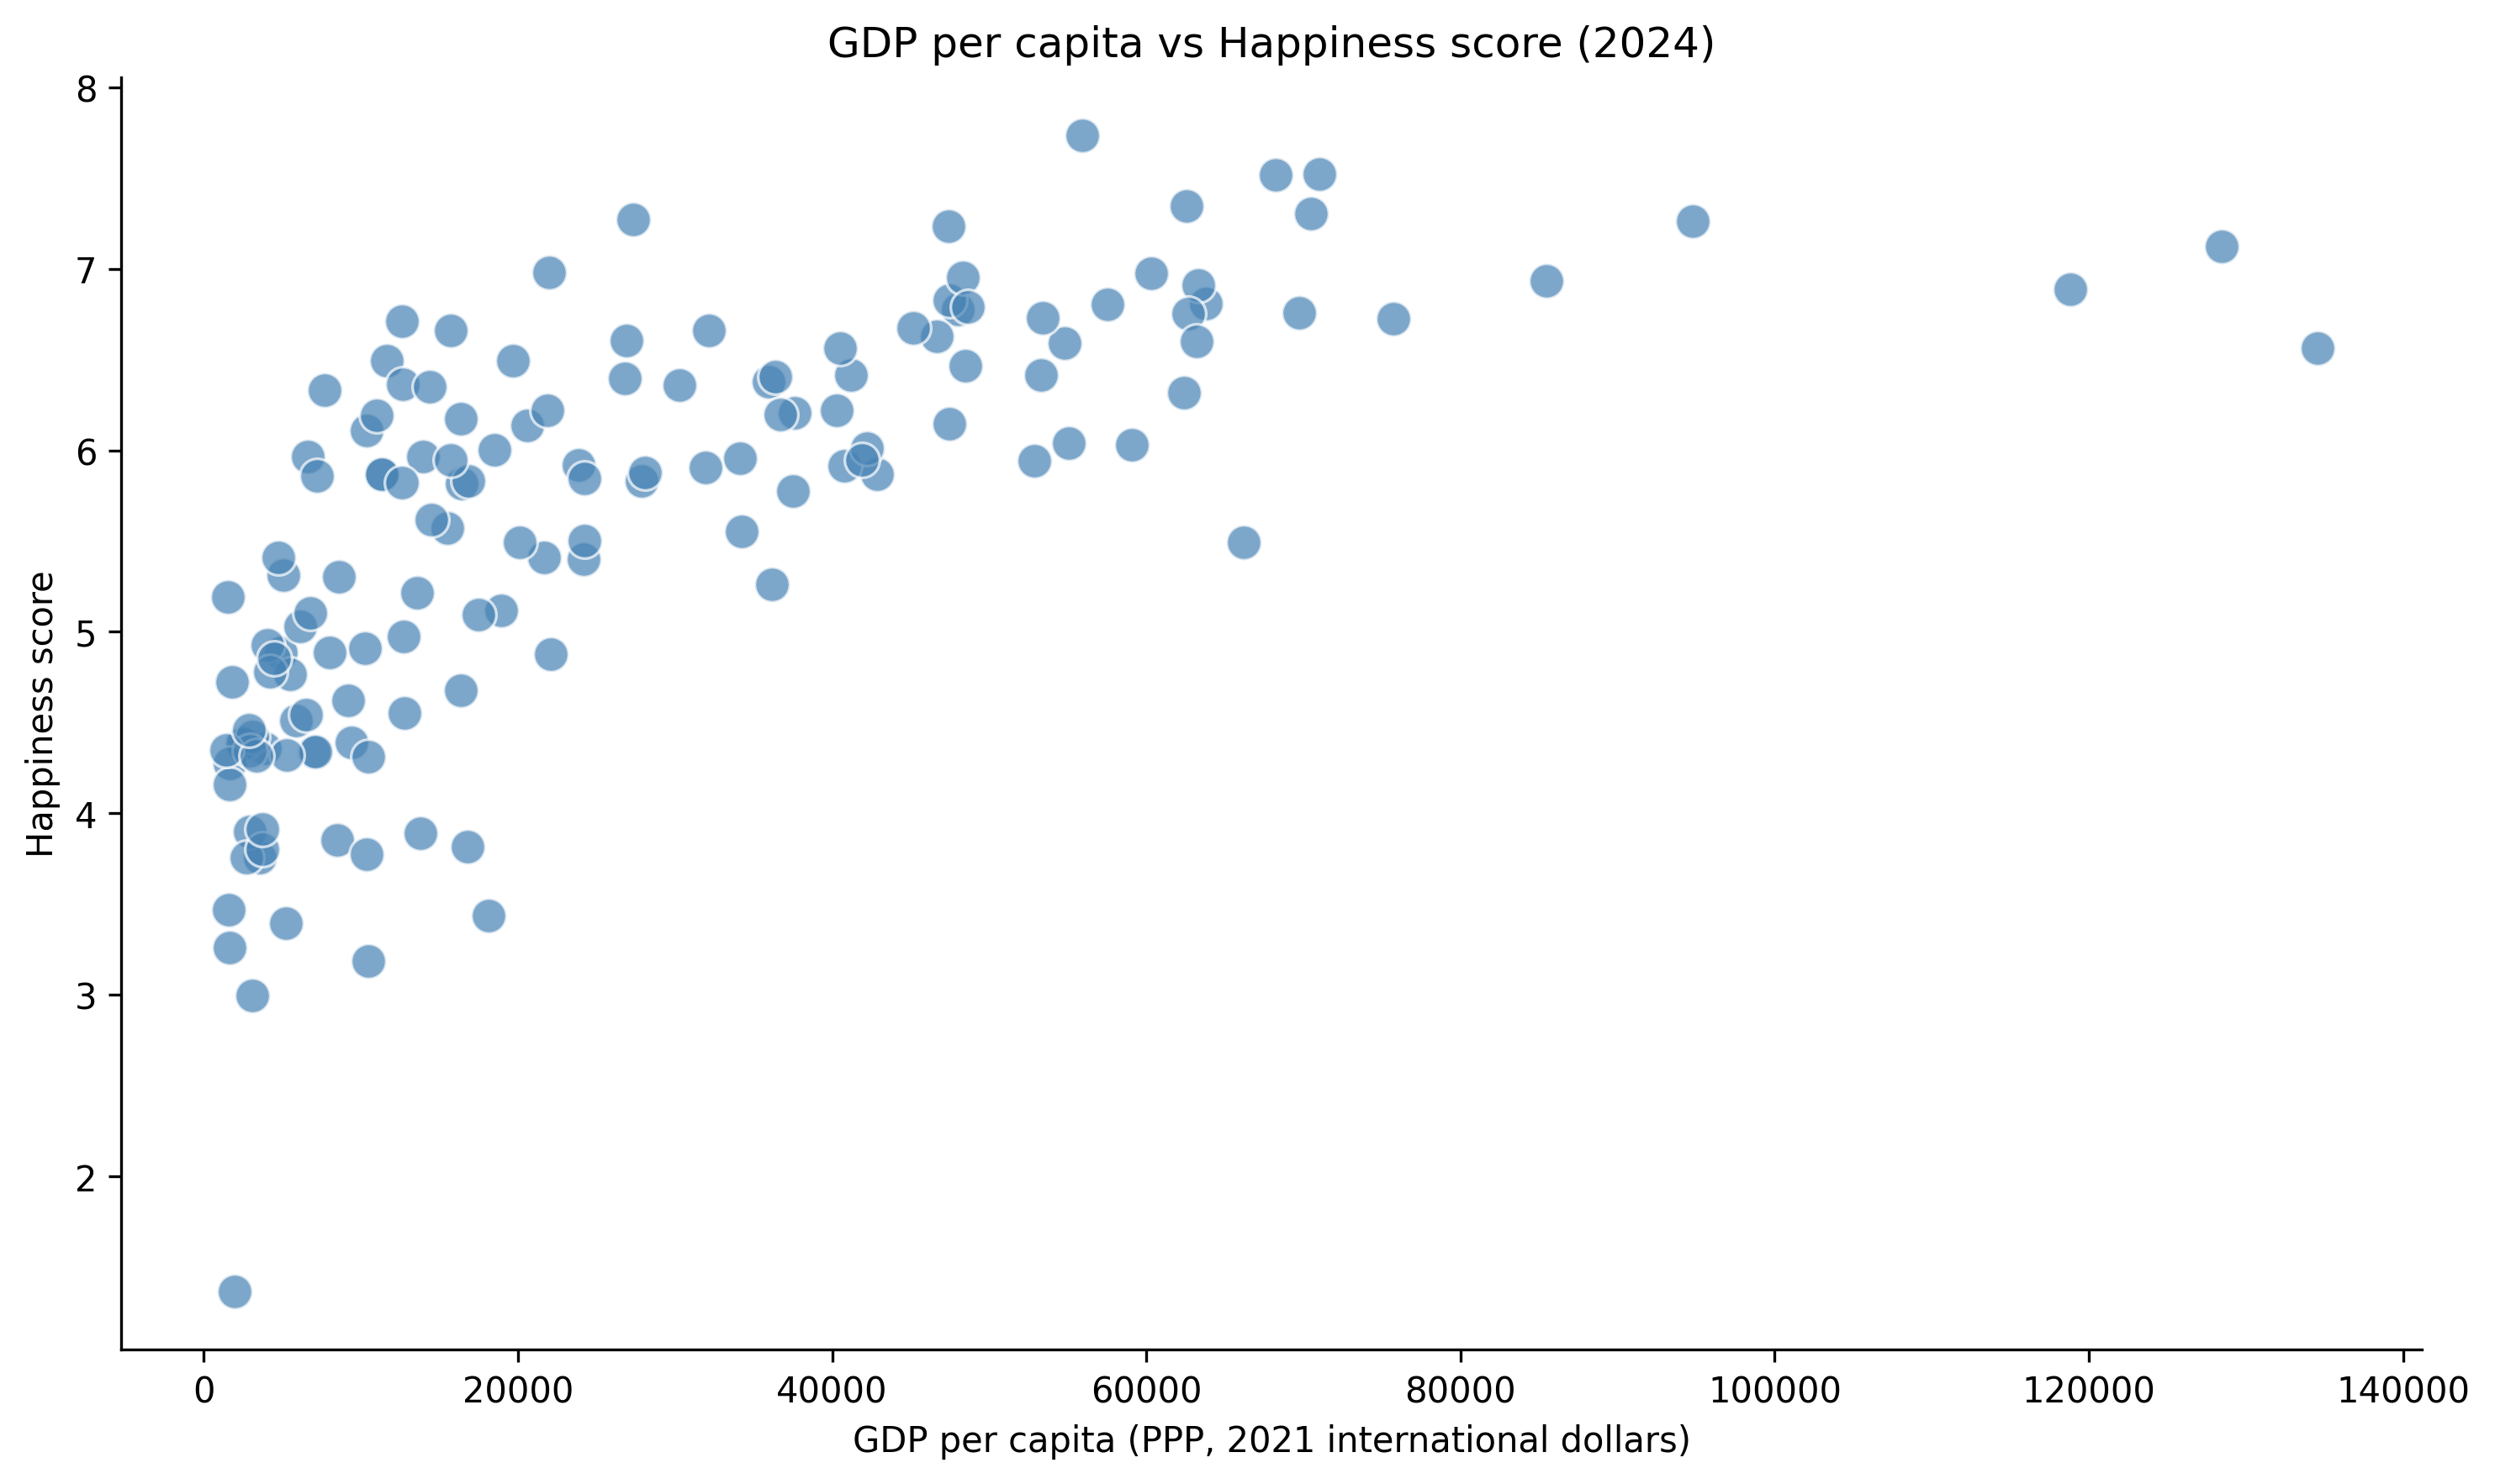
The joint distribution: one dot per country

Data: Gallup World Poll & World Bank, via Our World in Data

The joint distribution is one line of code, too


sns.scatterplot(data=happy, x='GDP_pc', y='Happiness')

The median split, in color

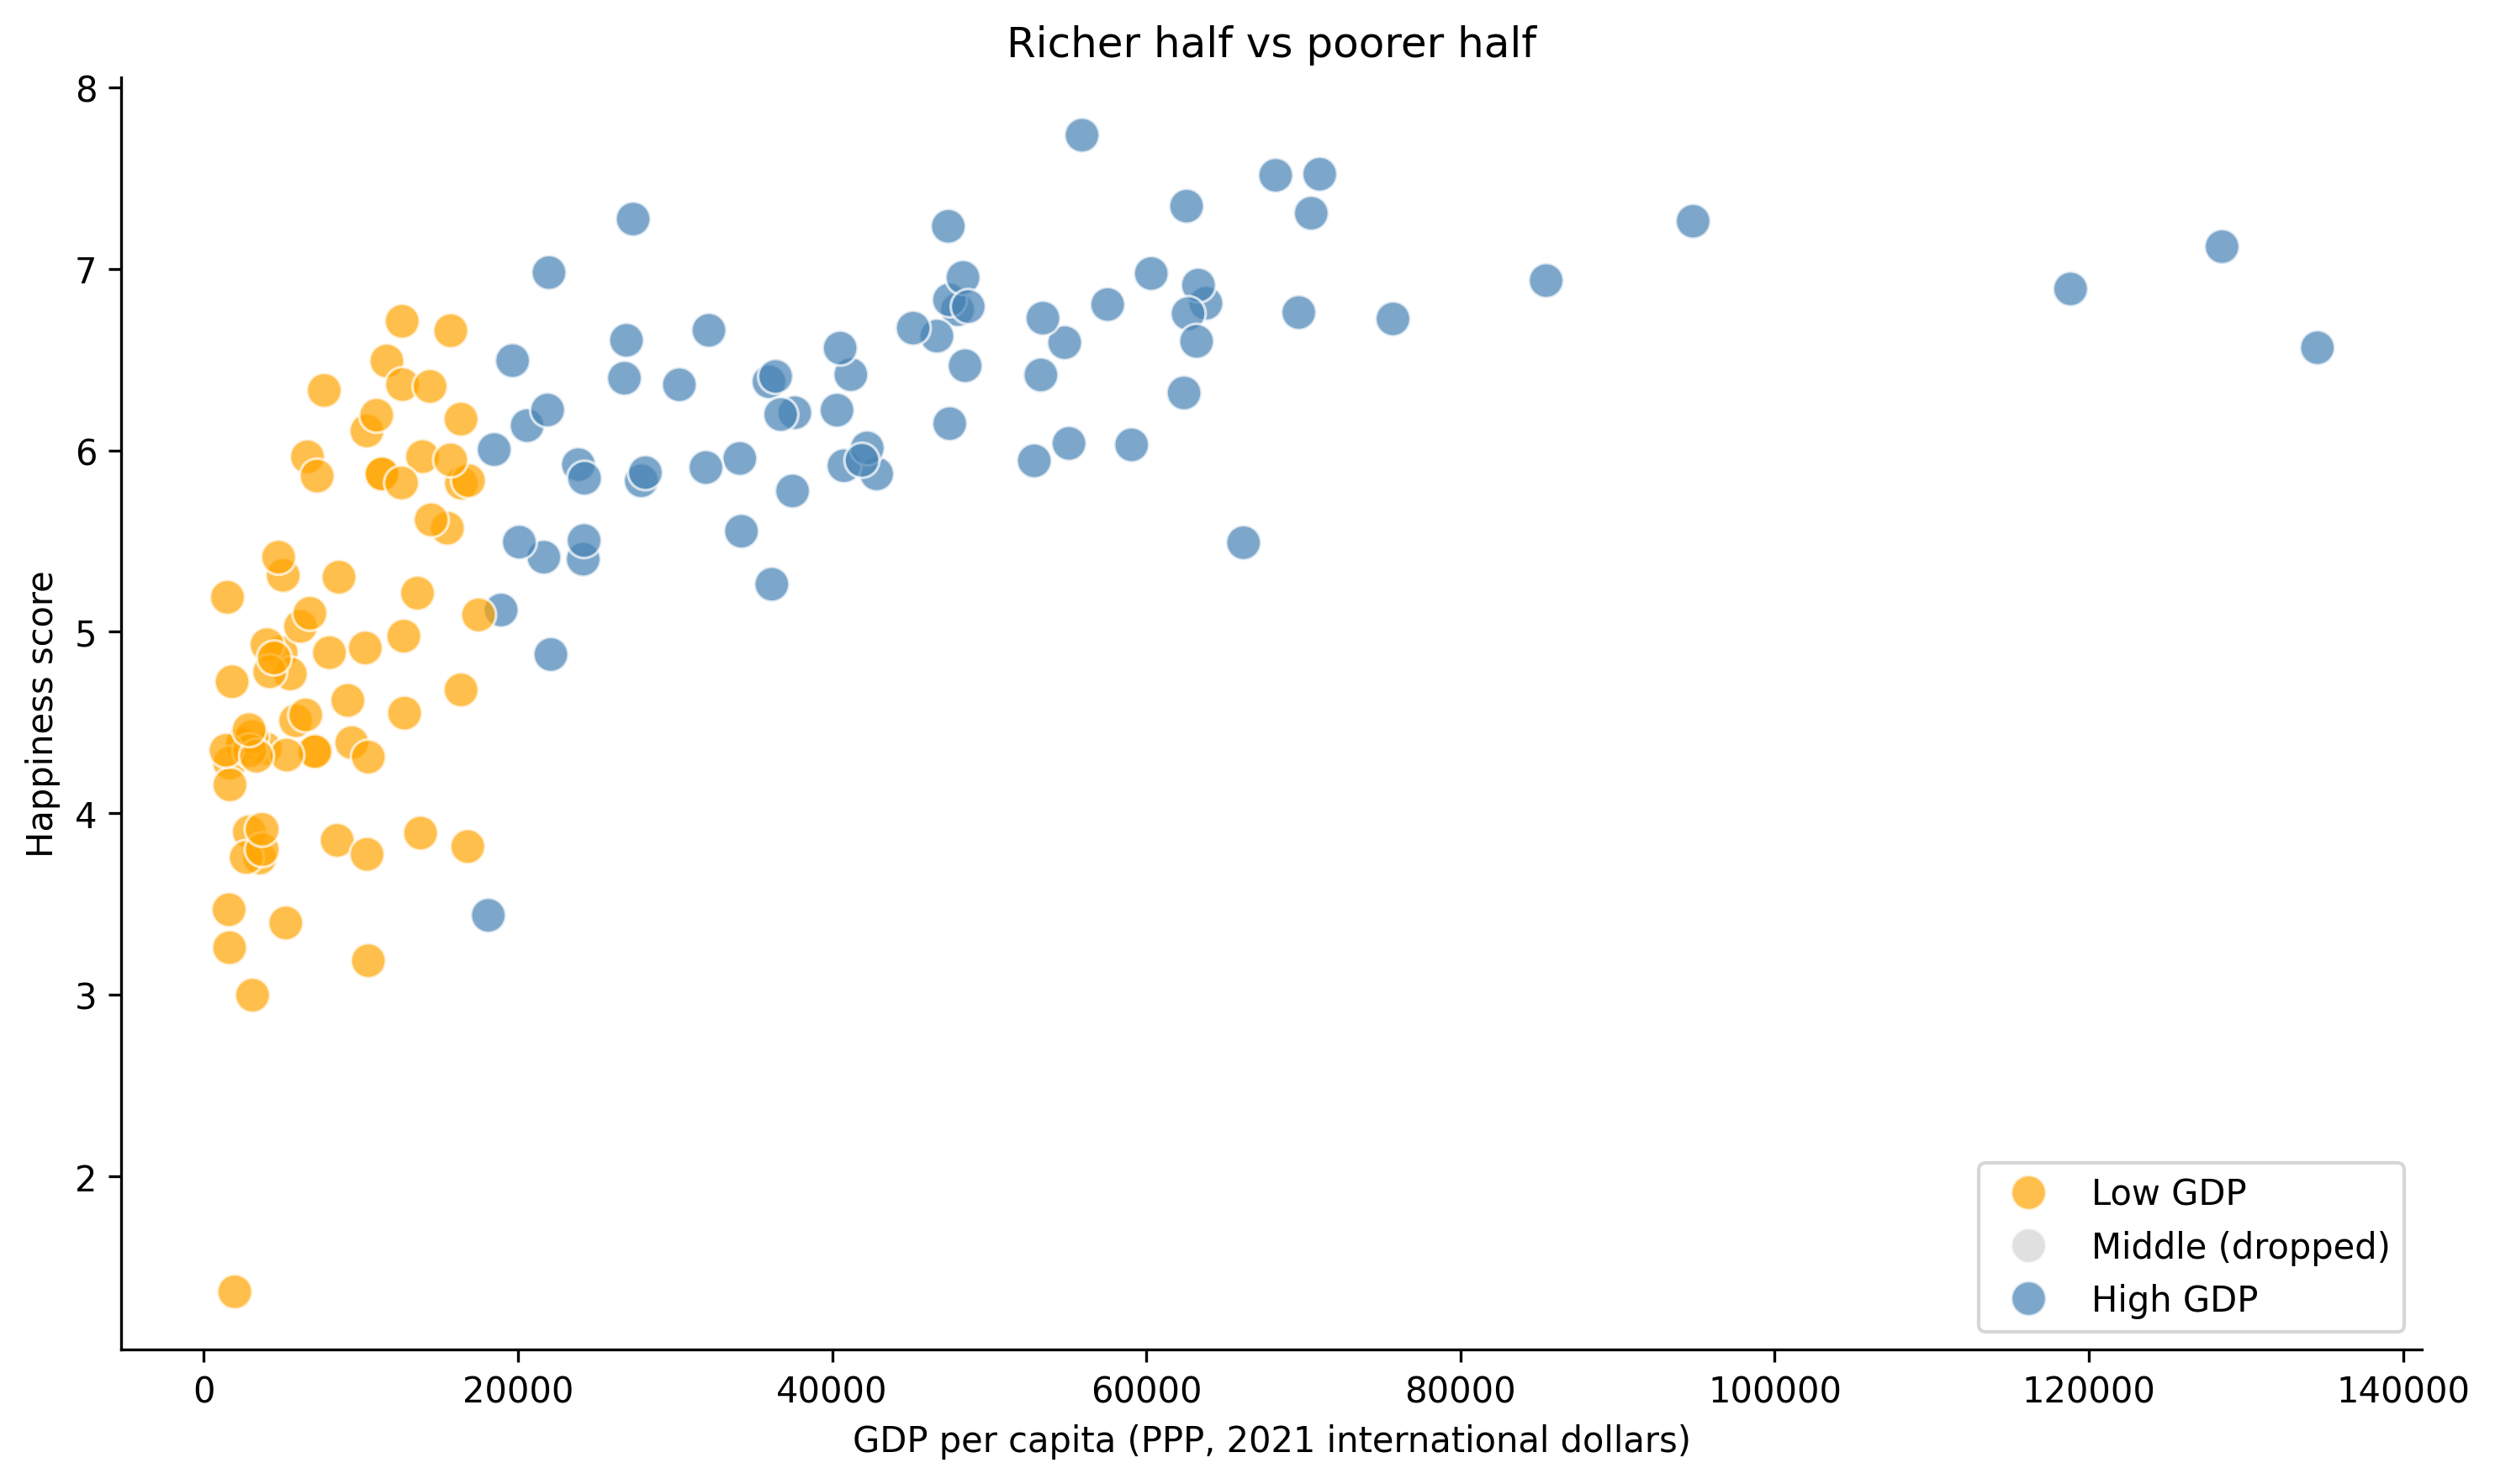
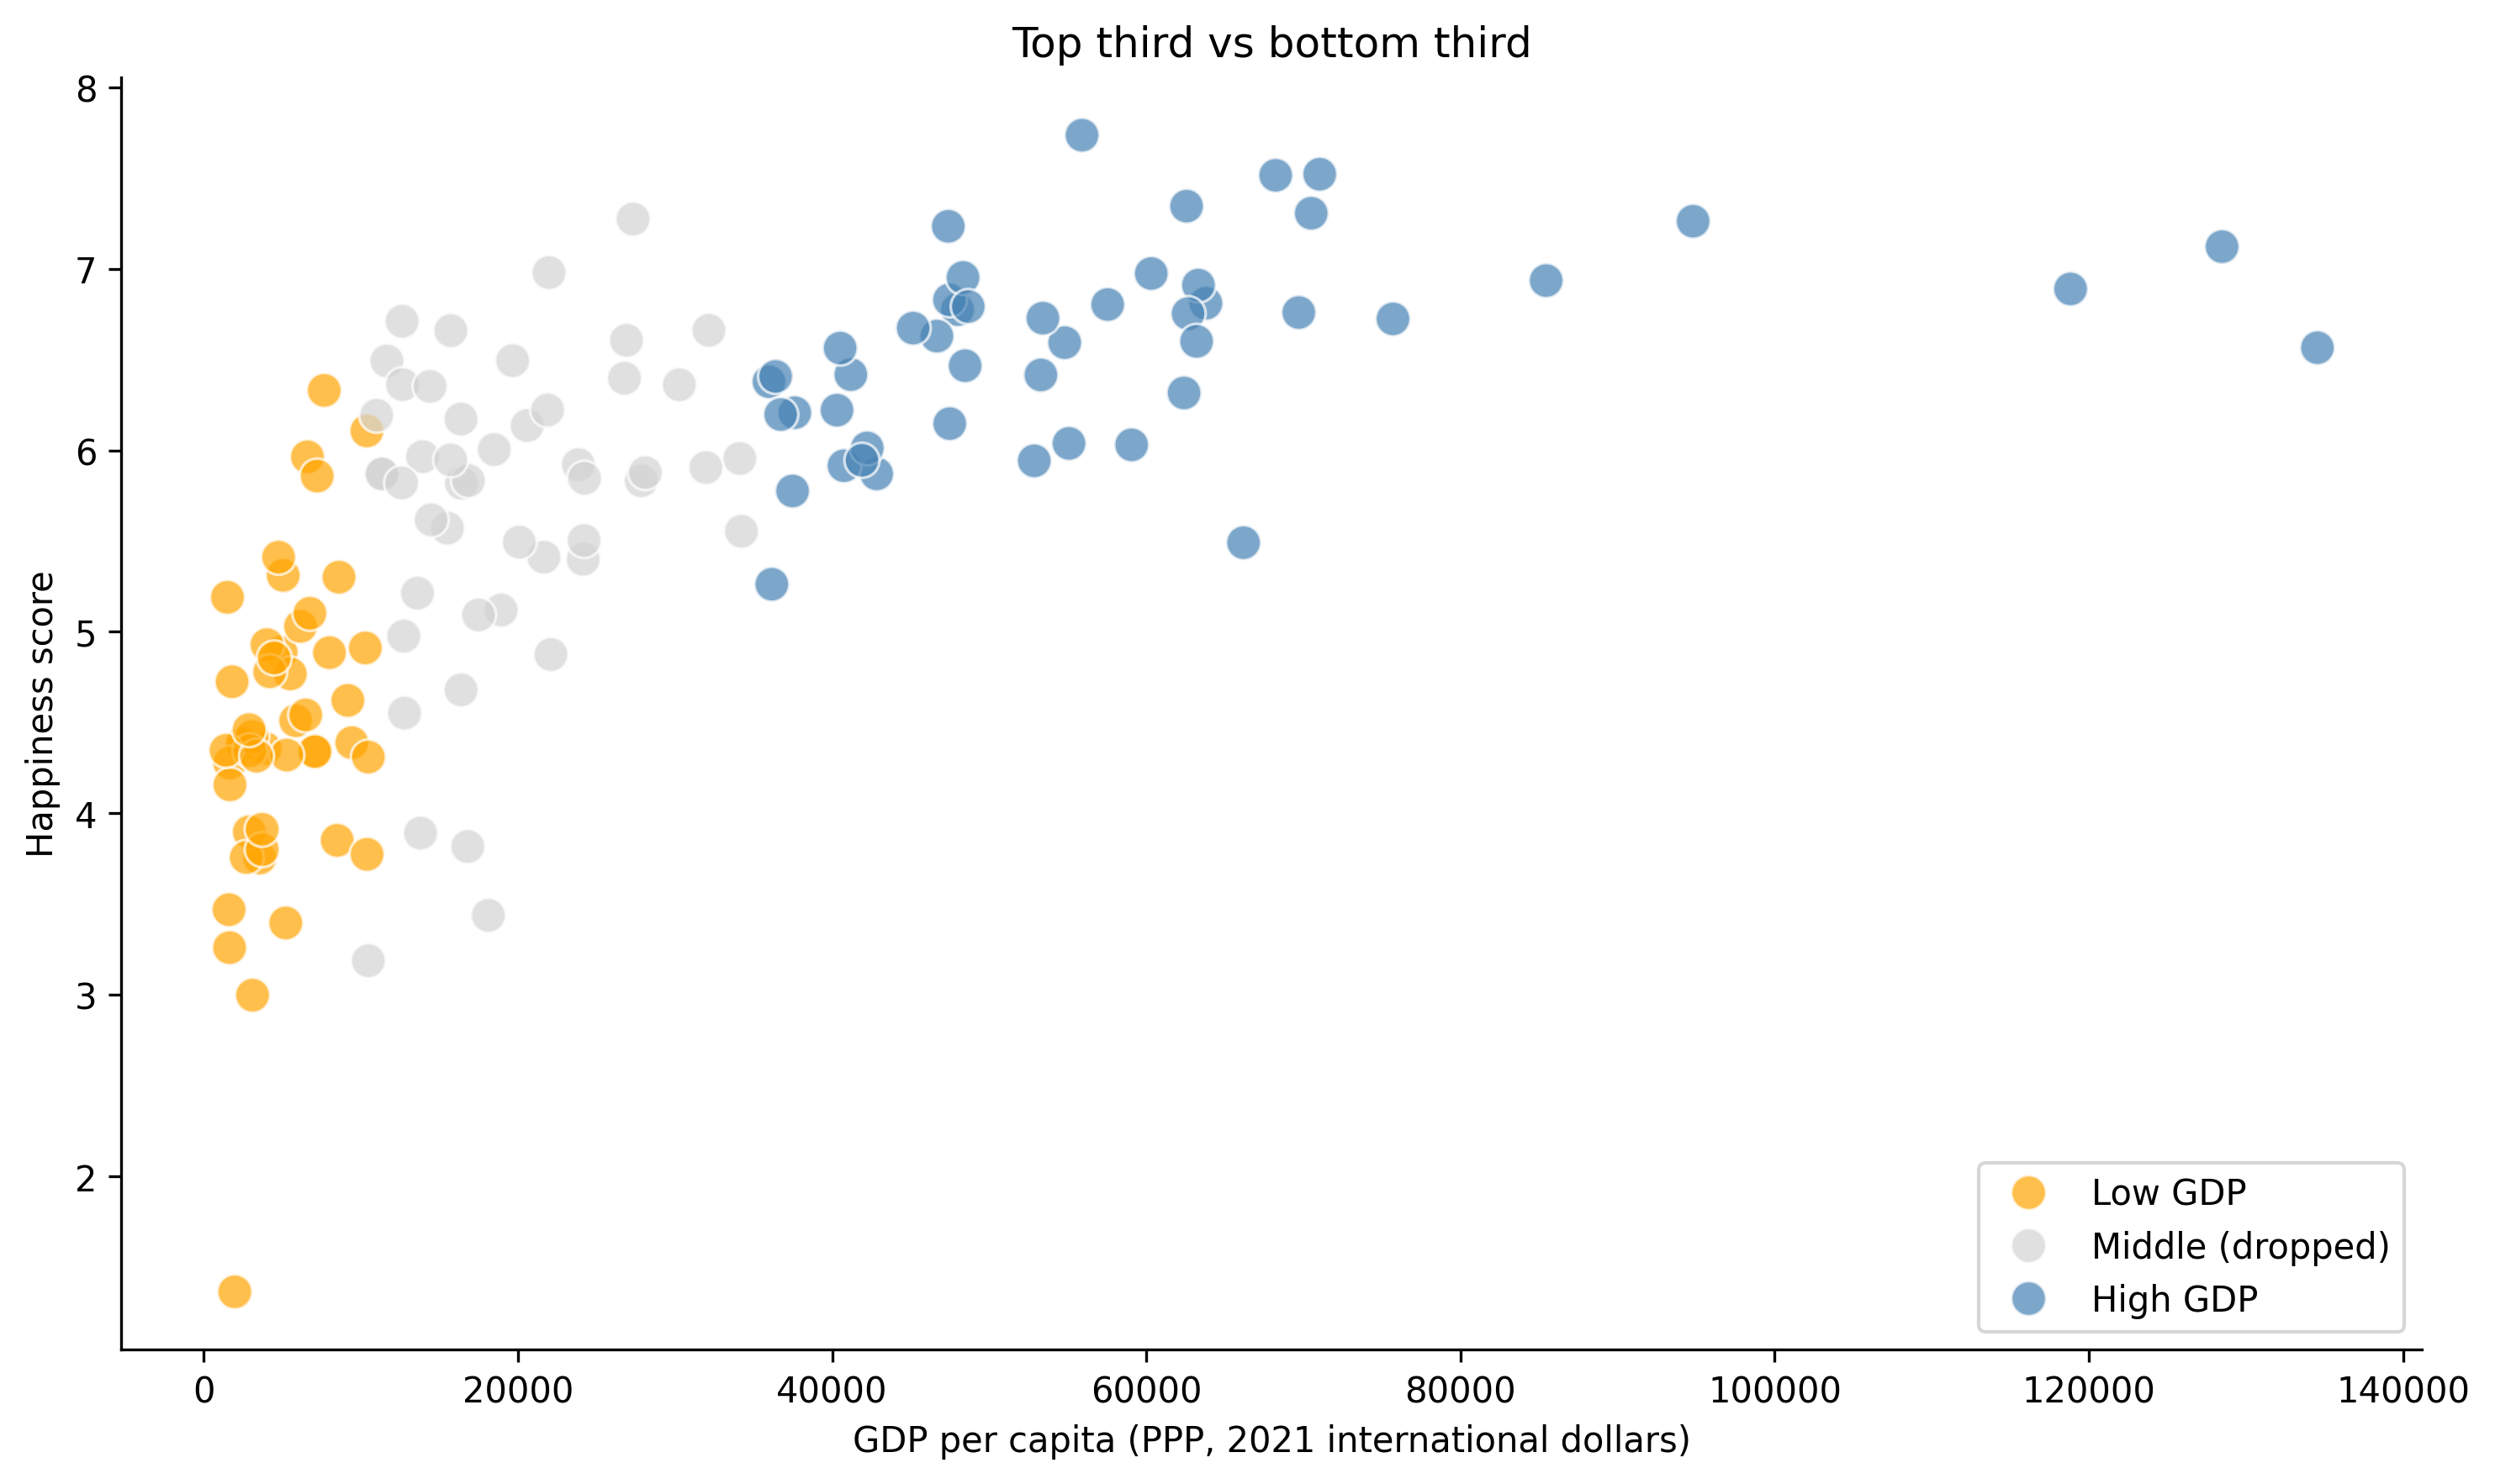
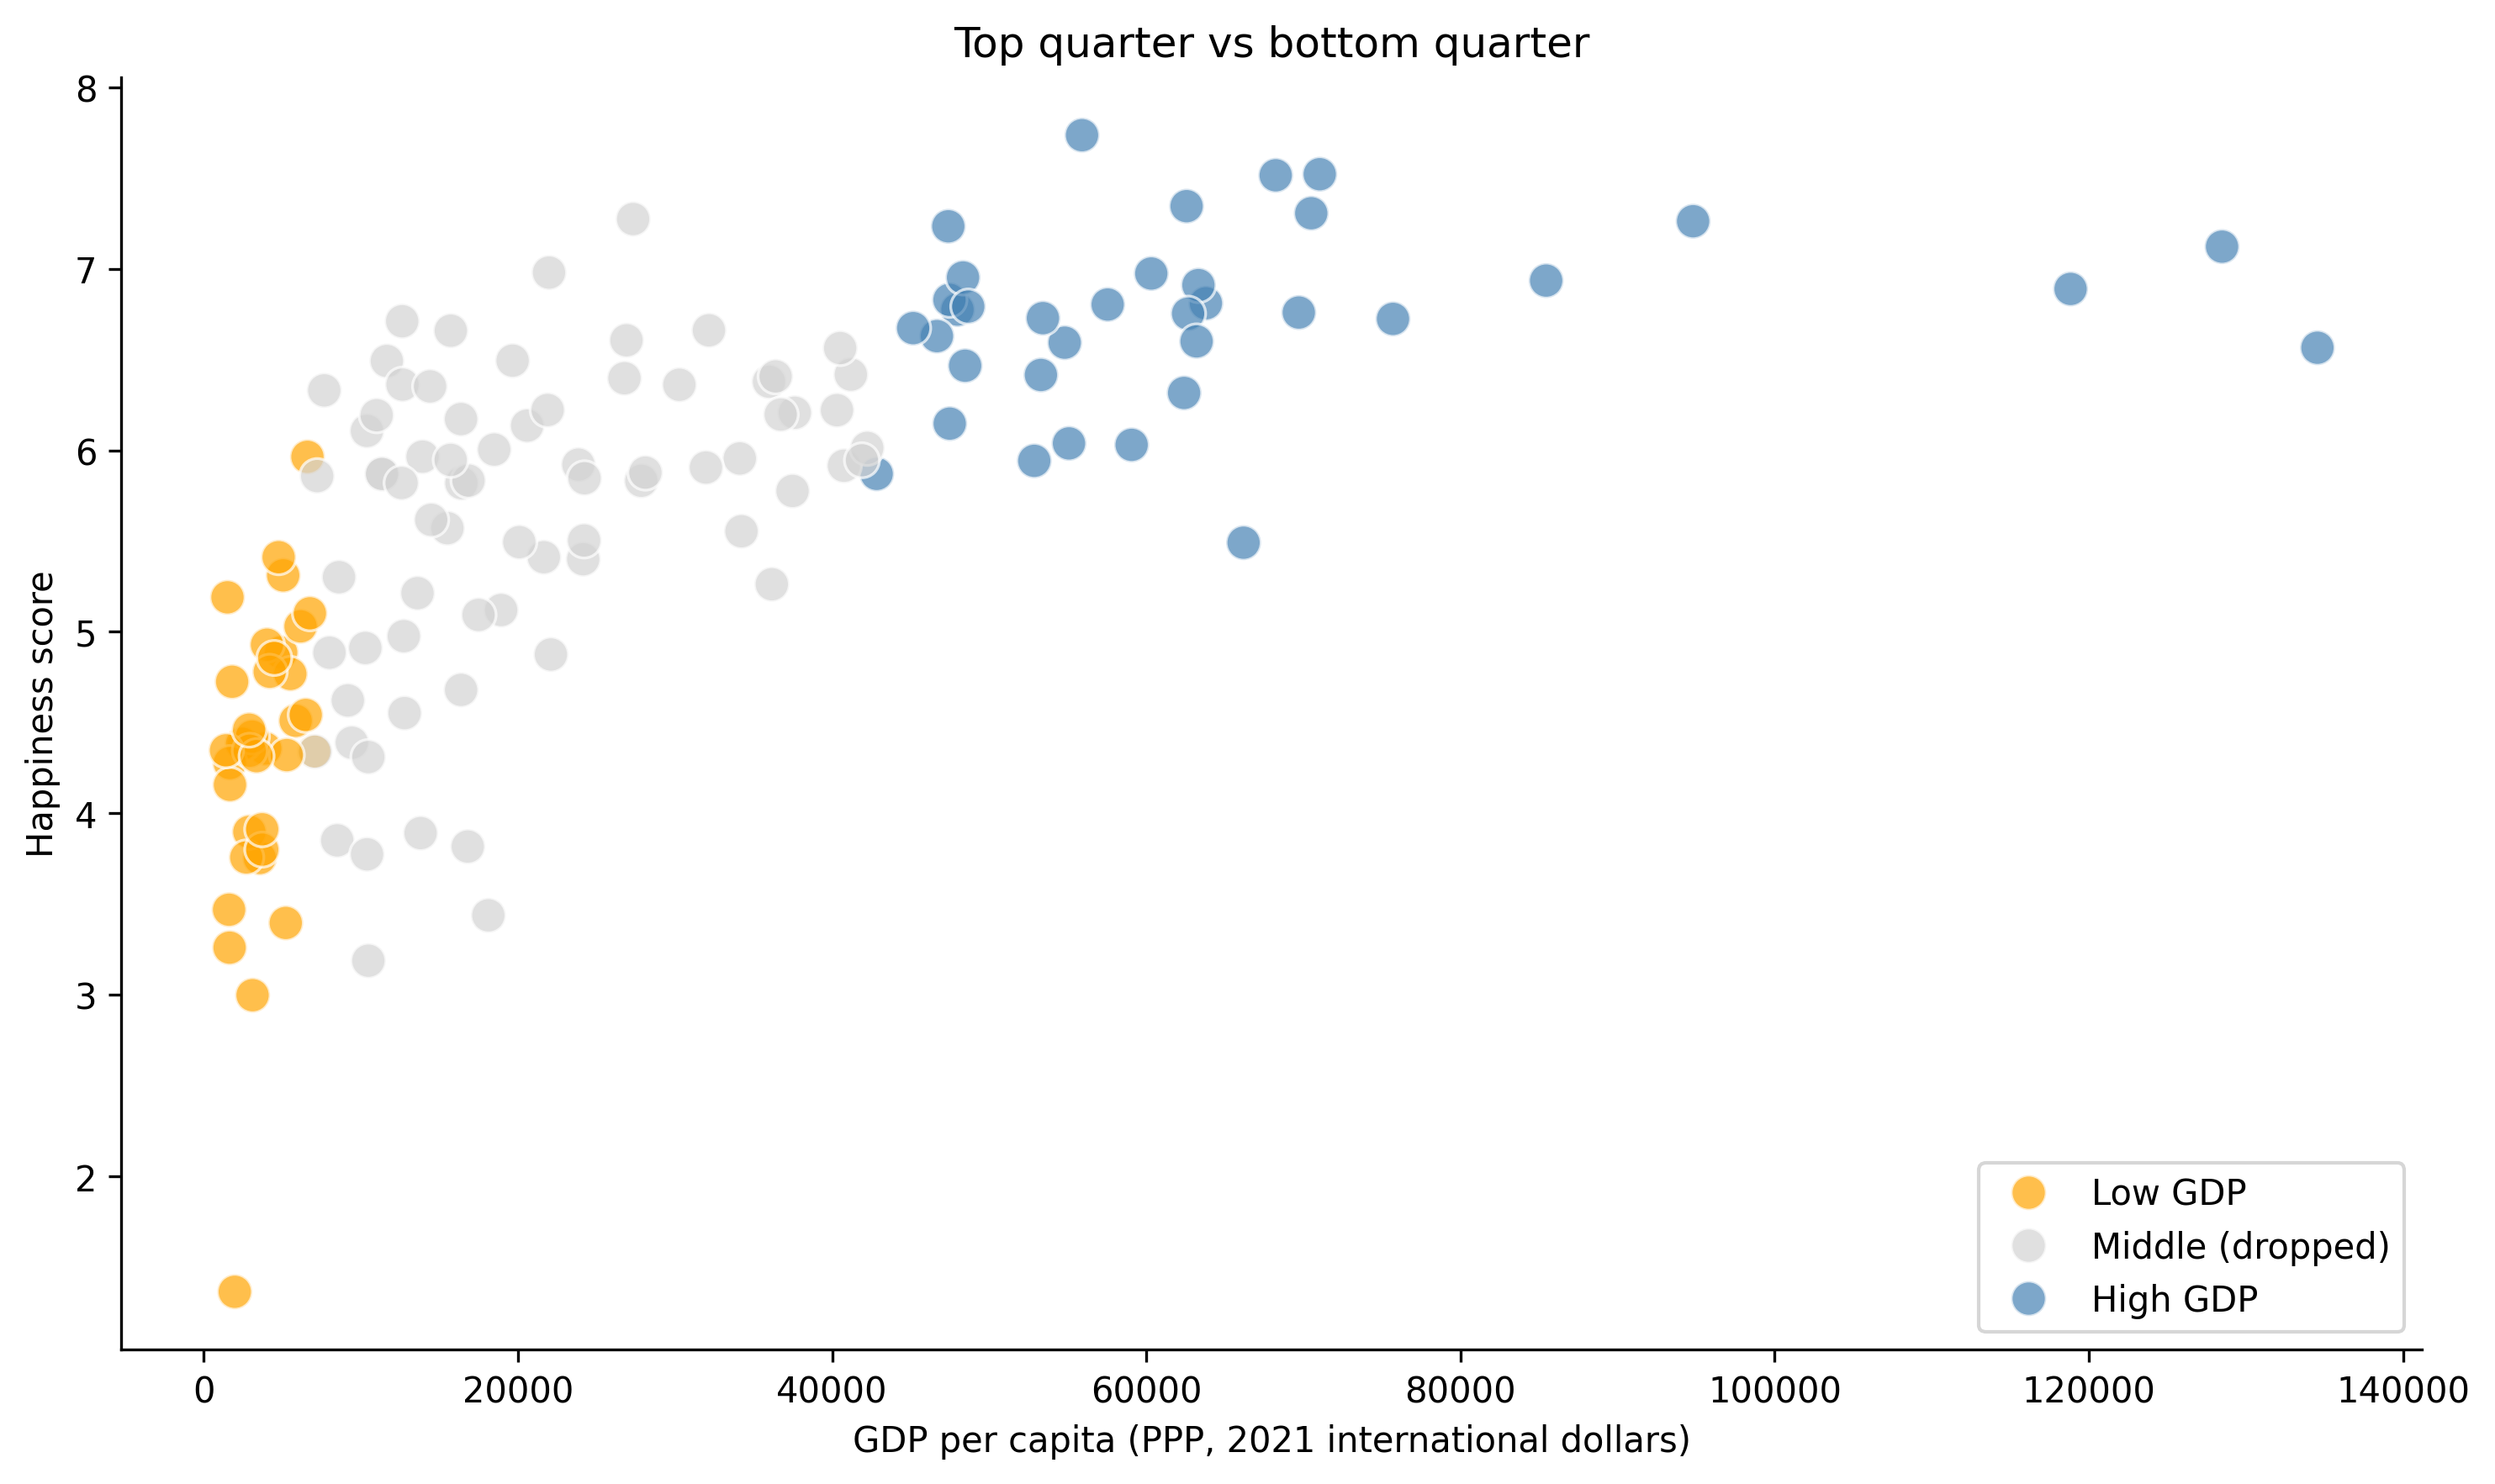
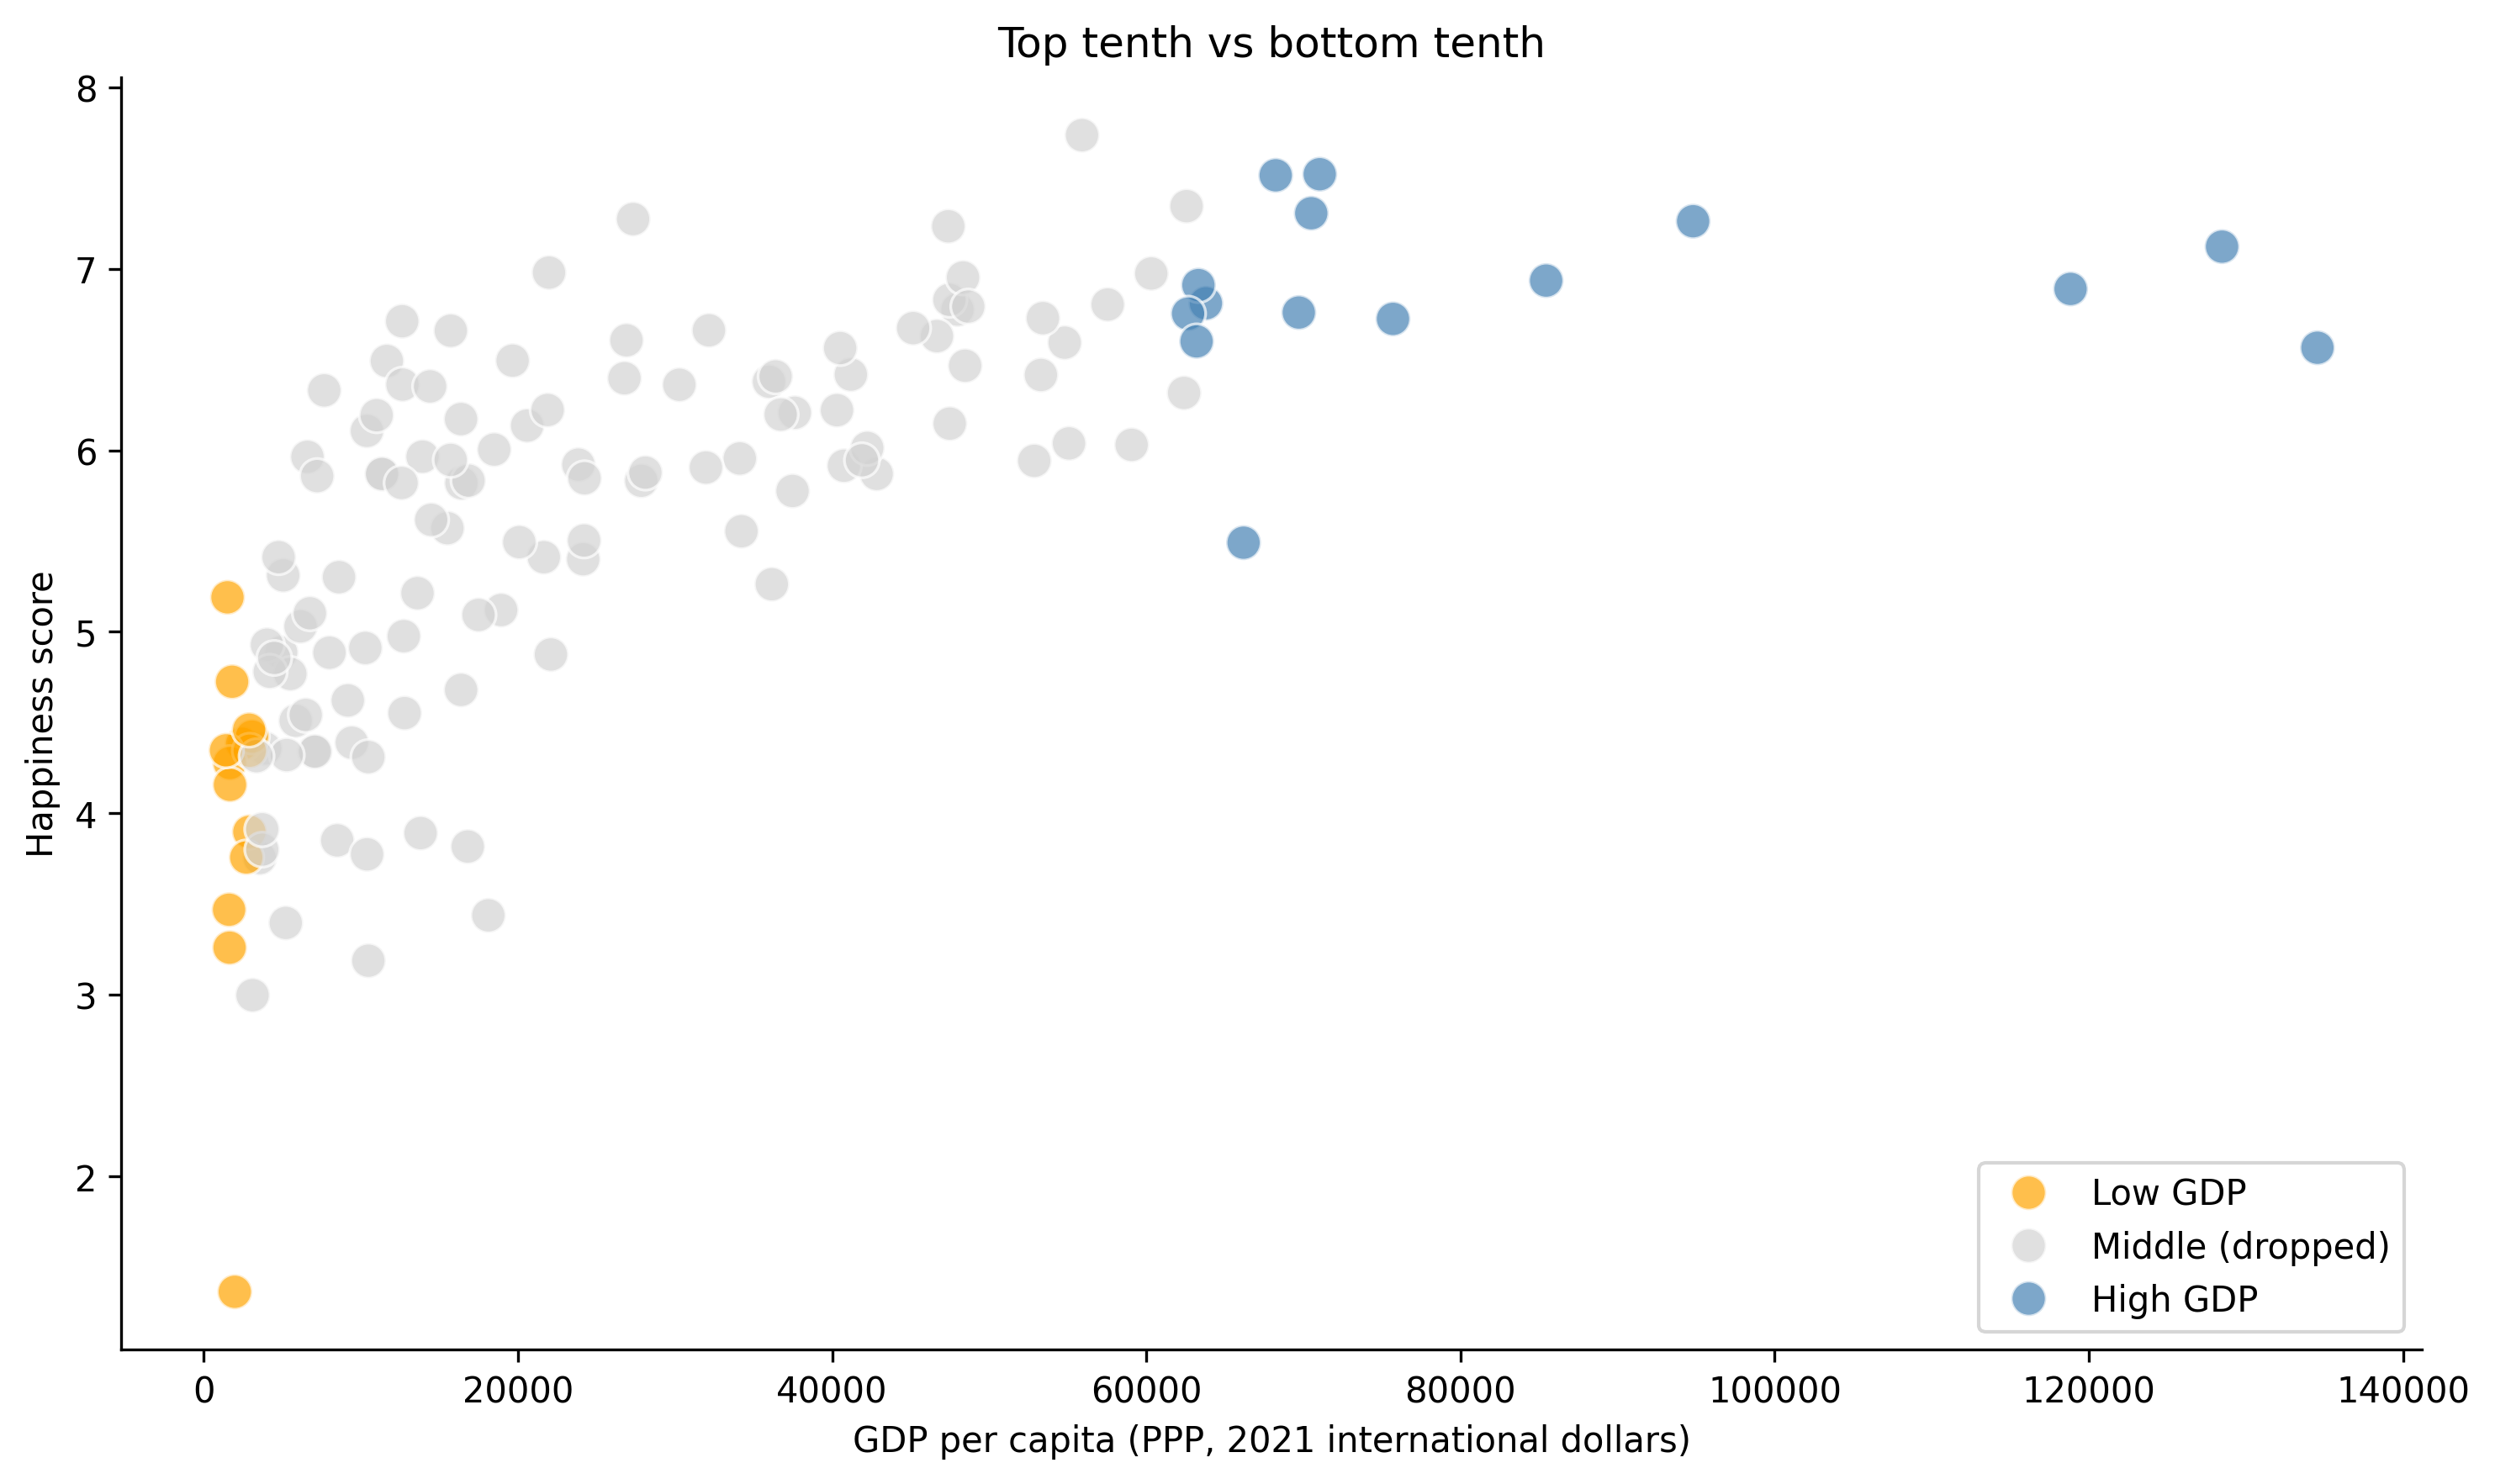
Is the median the right split?

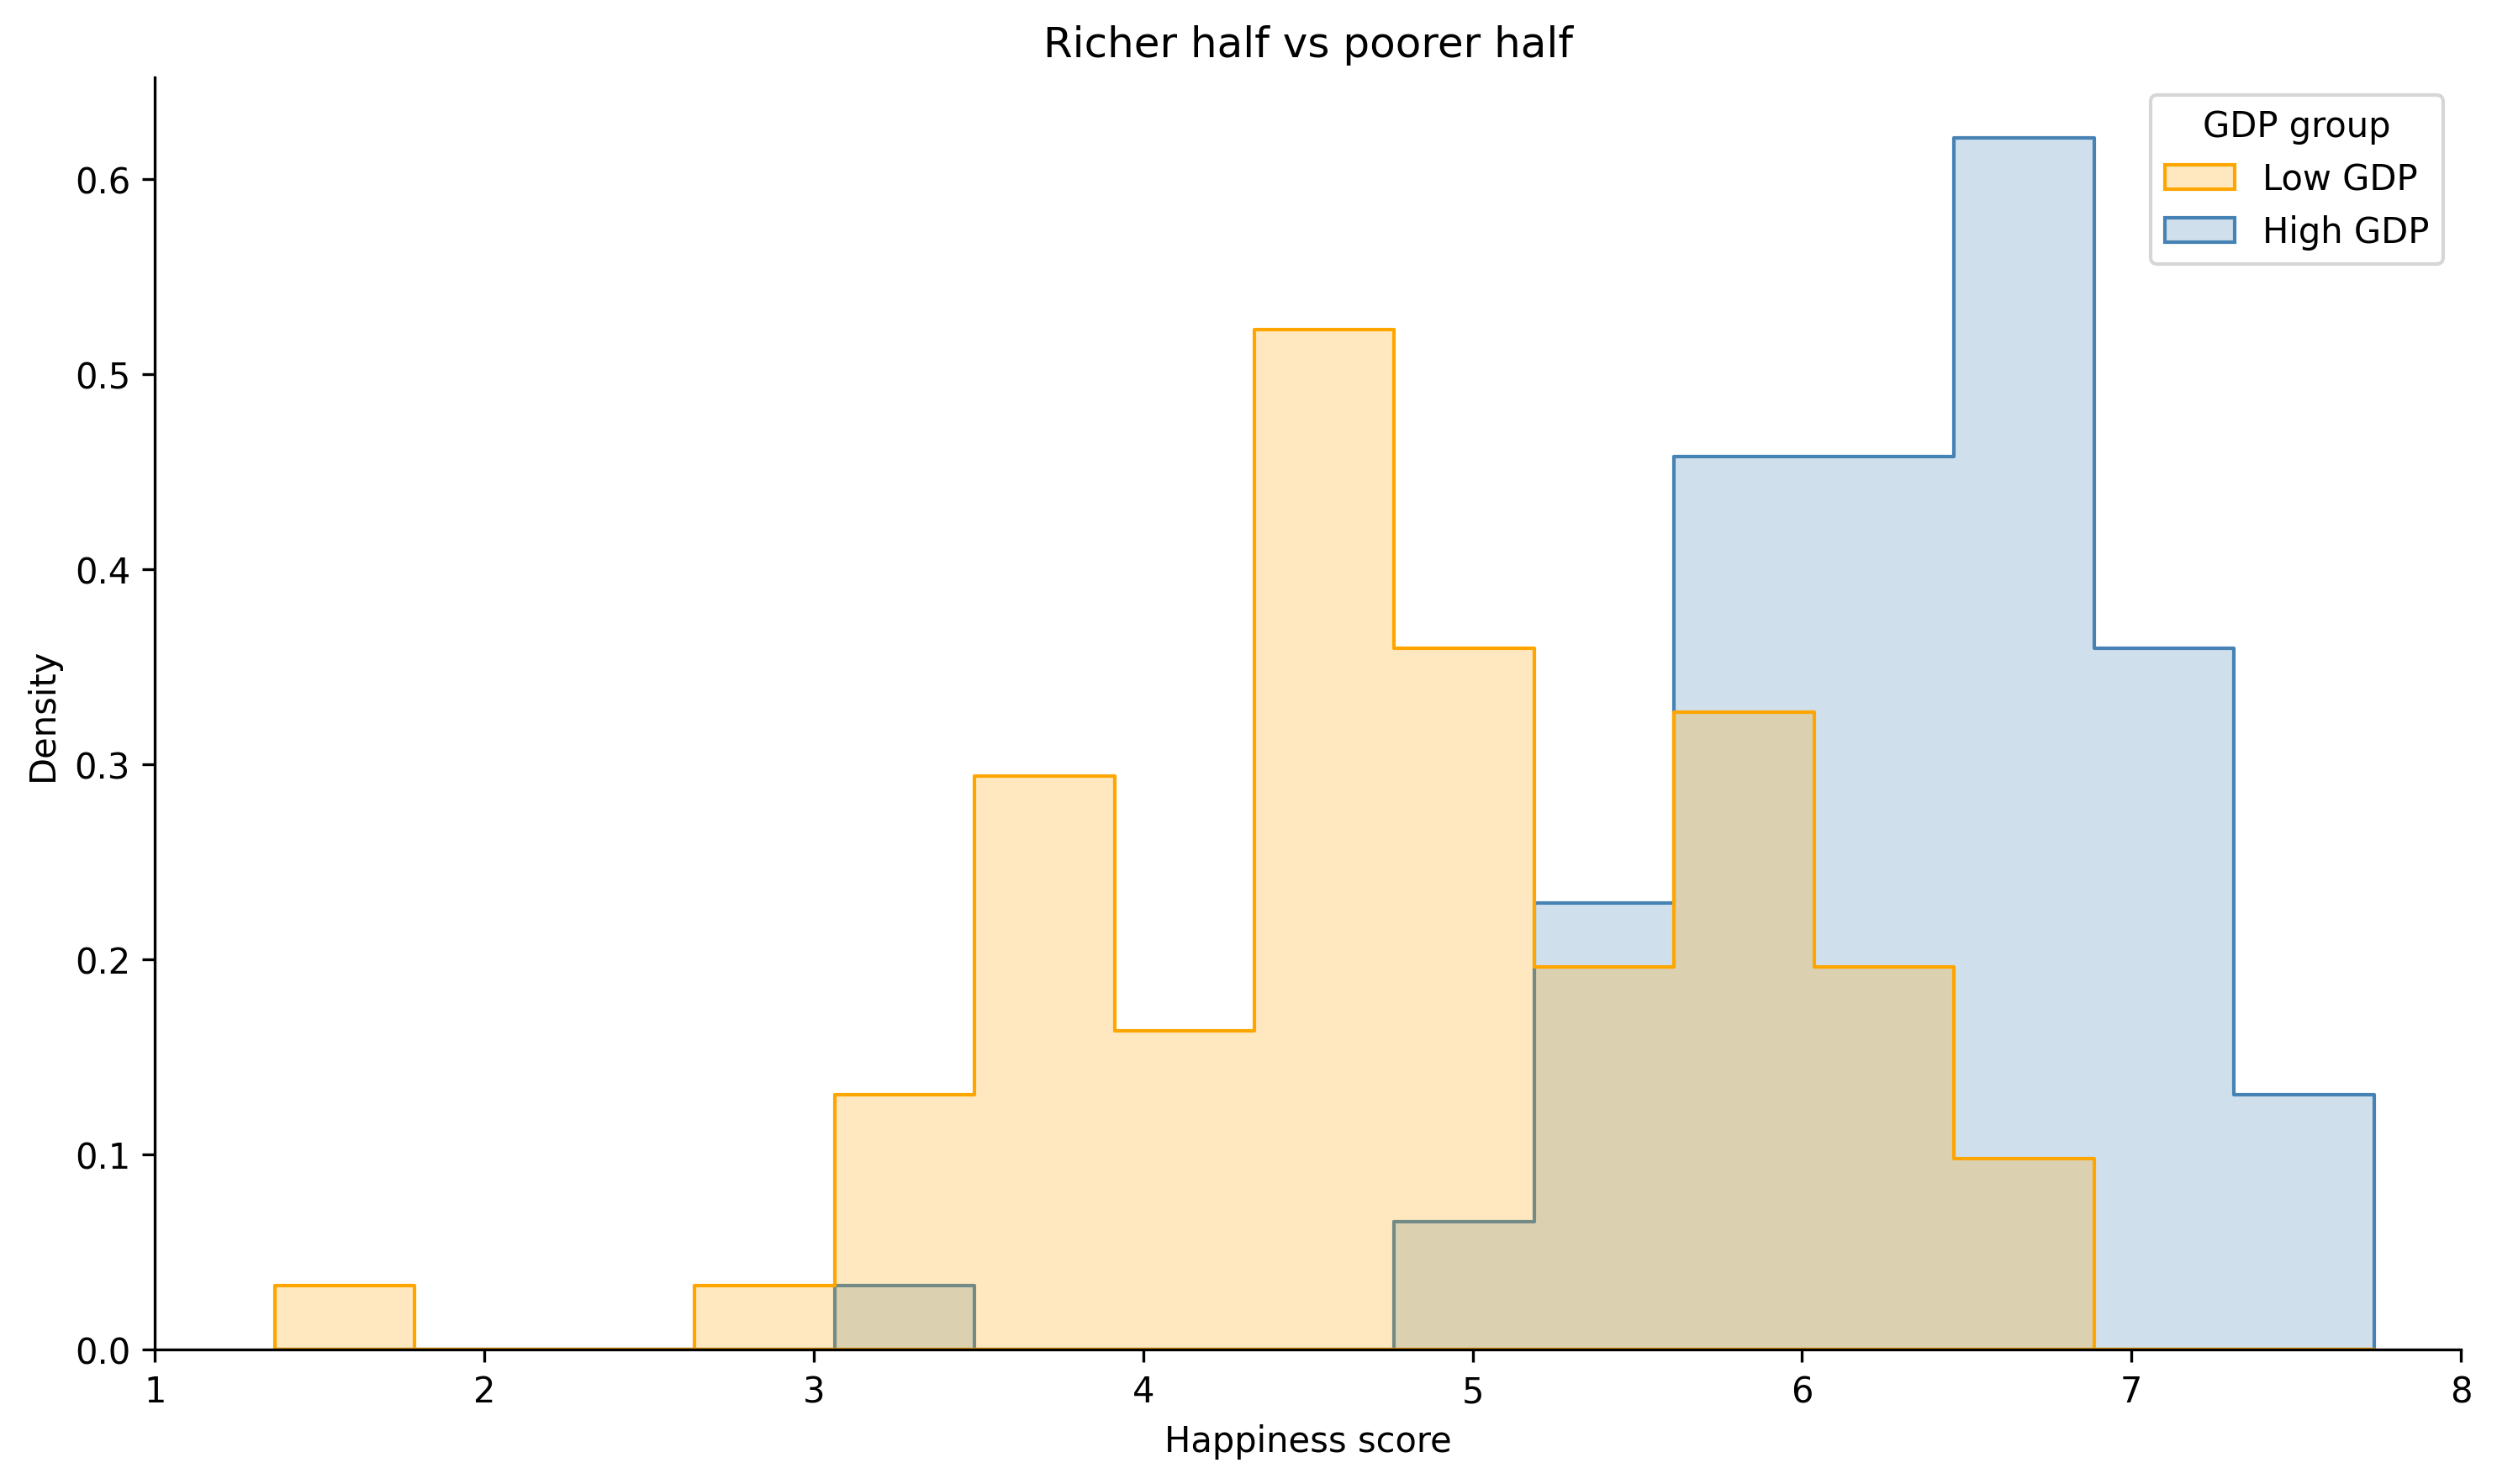
  • Richer half vs poorer half
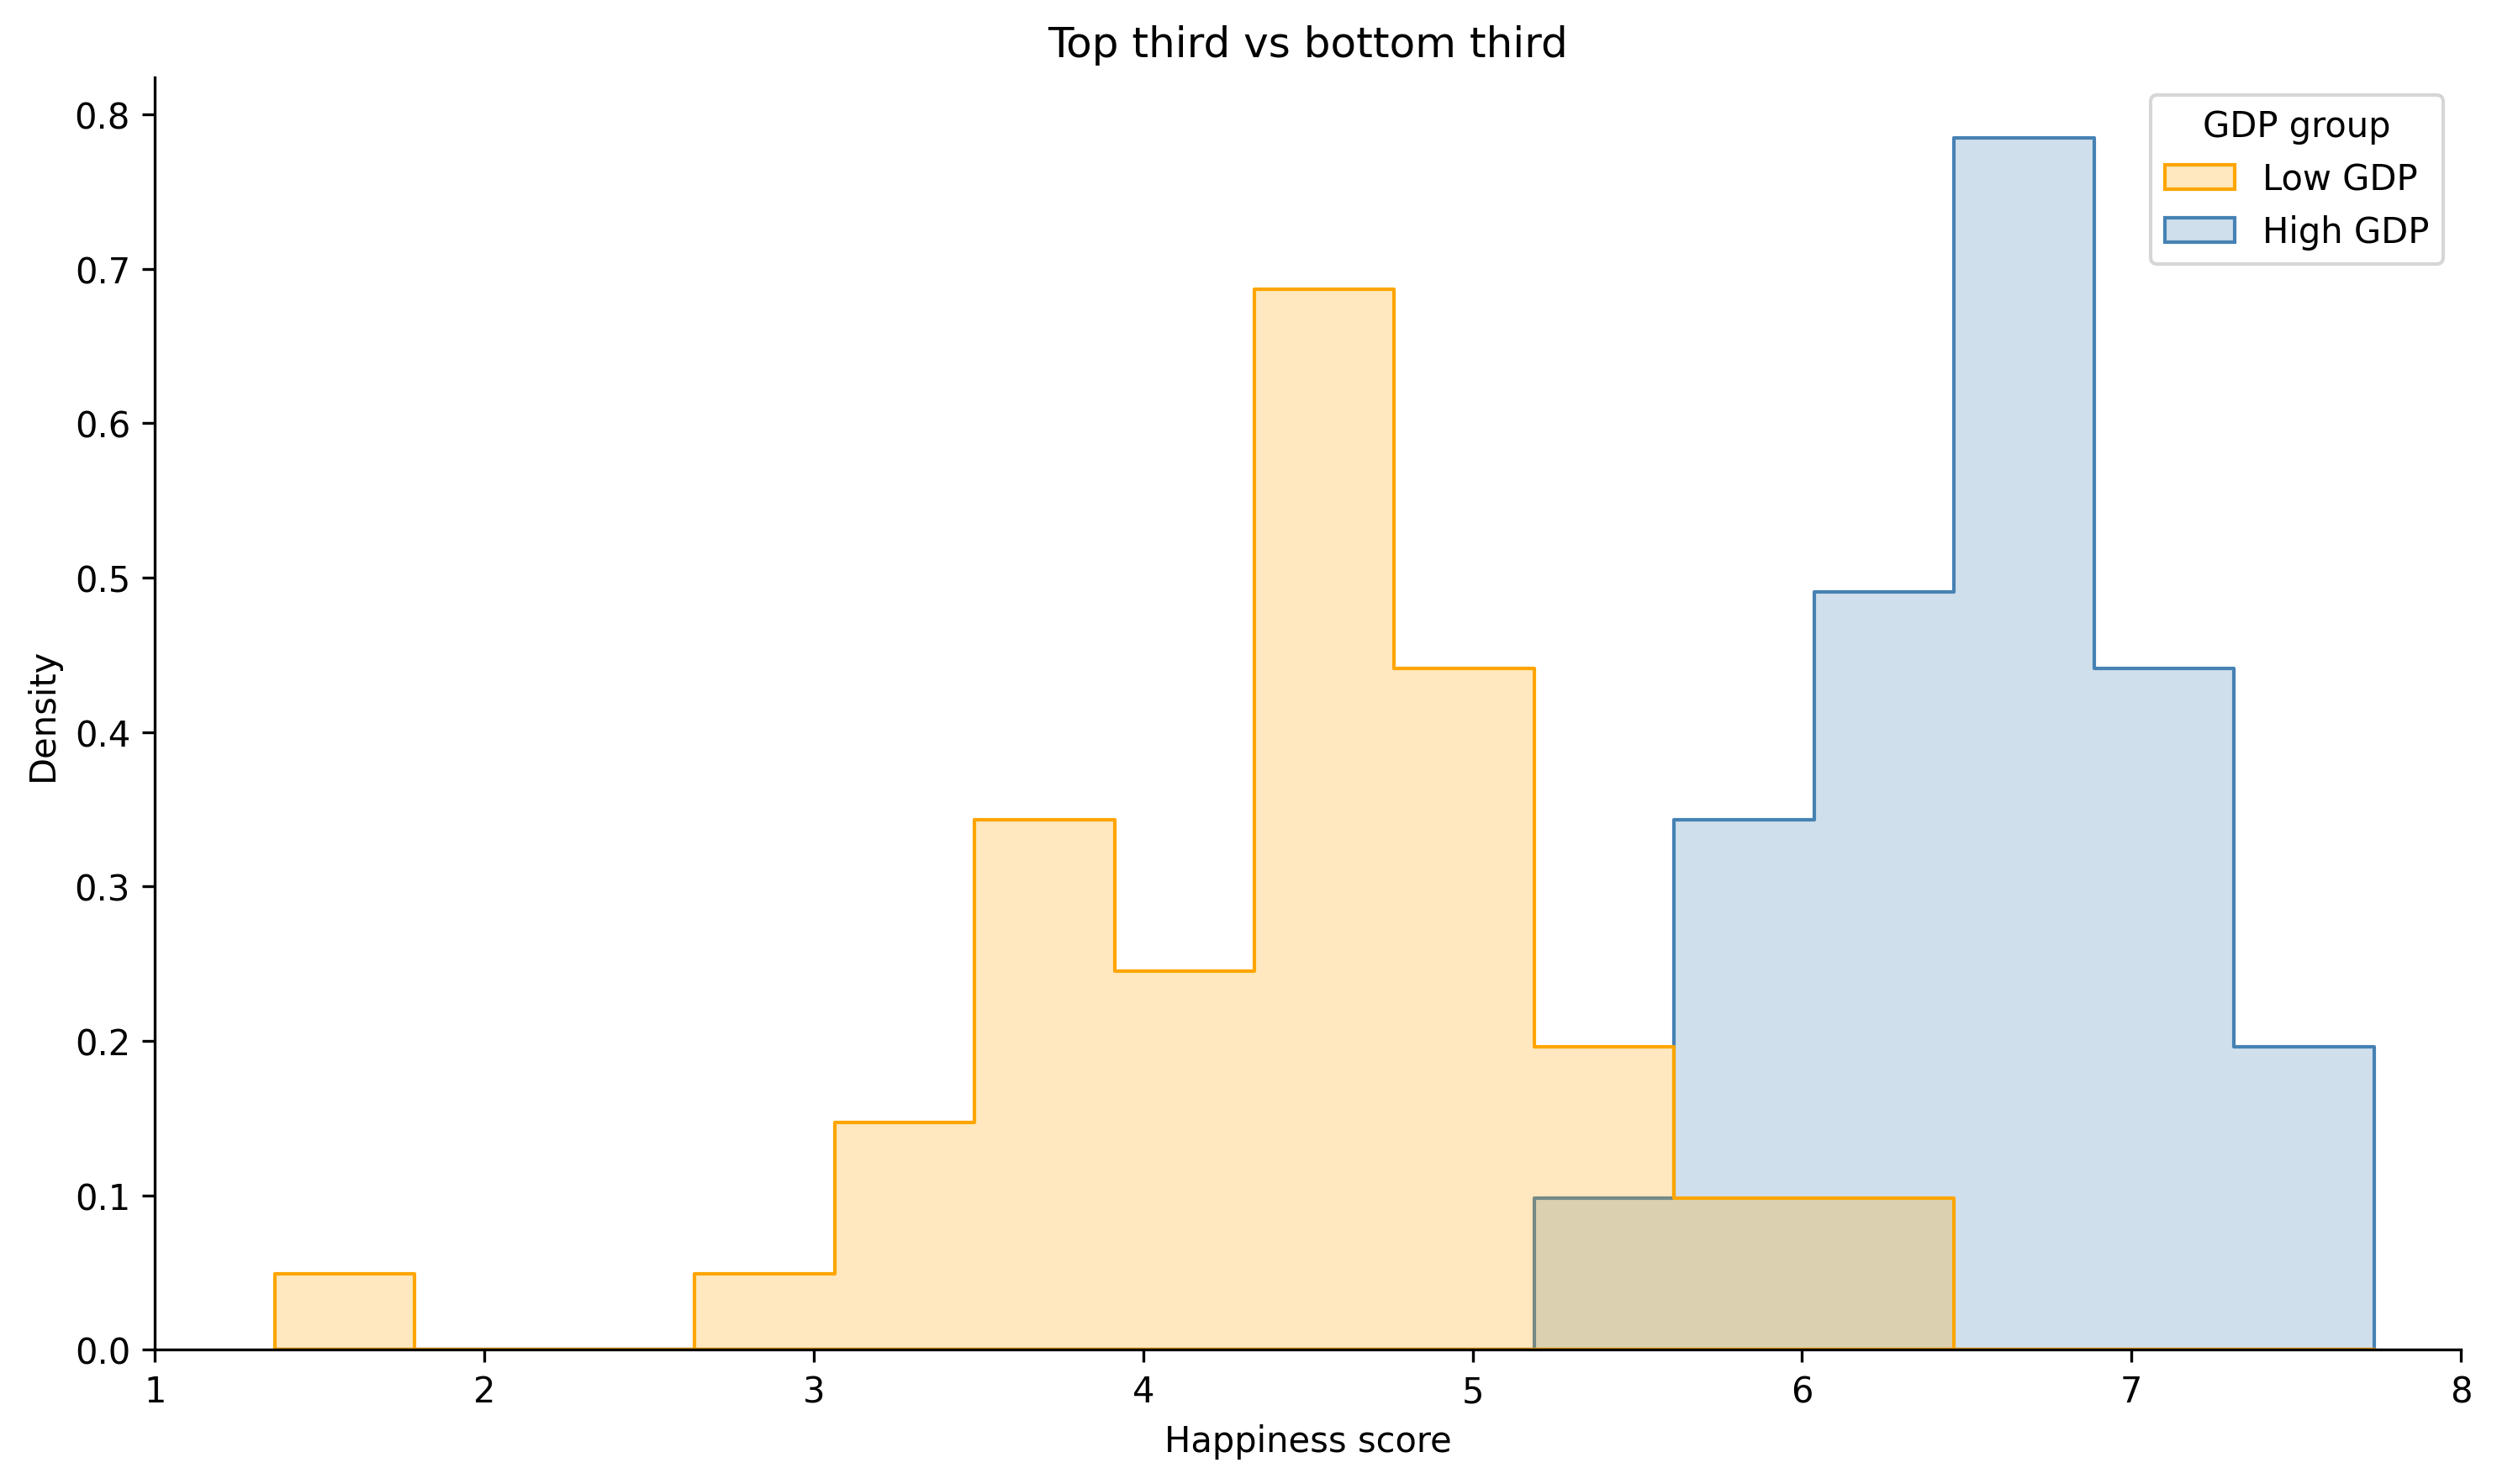
  • Top third vs bottom third
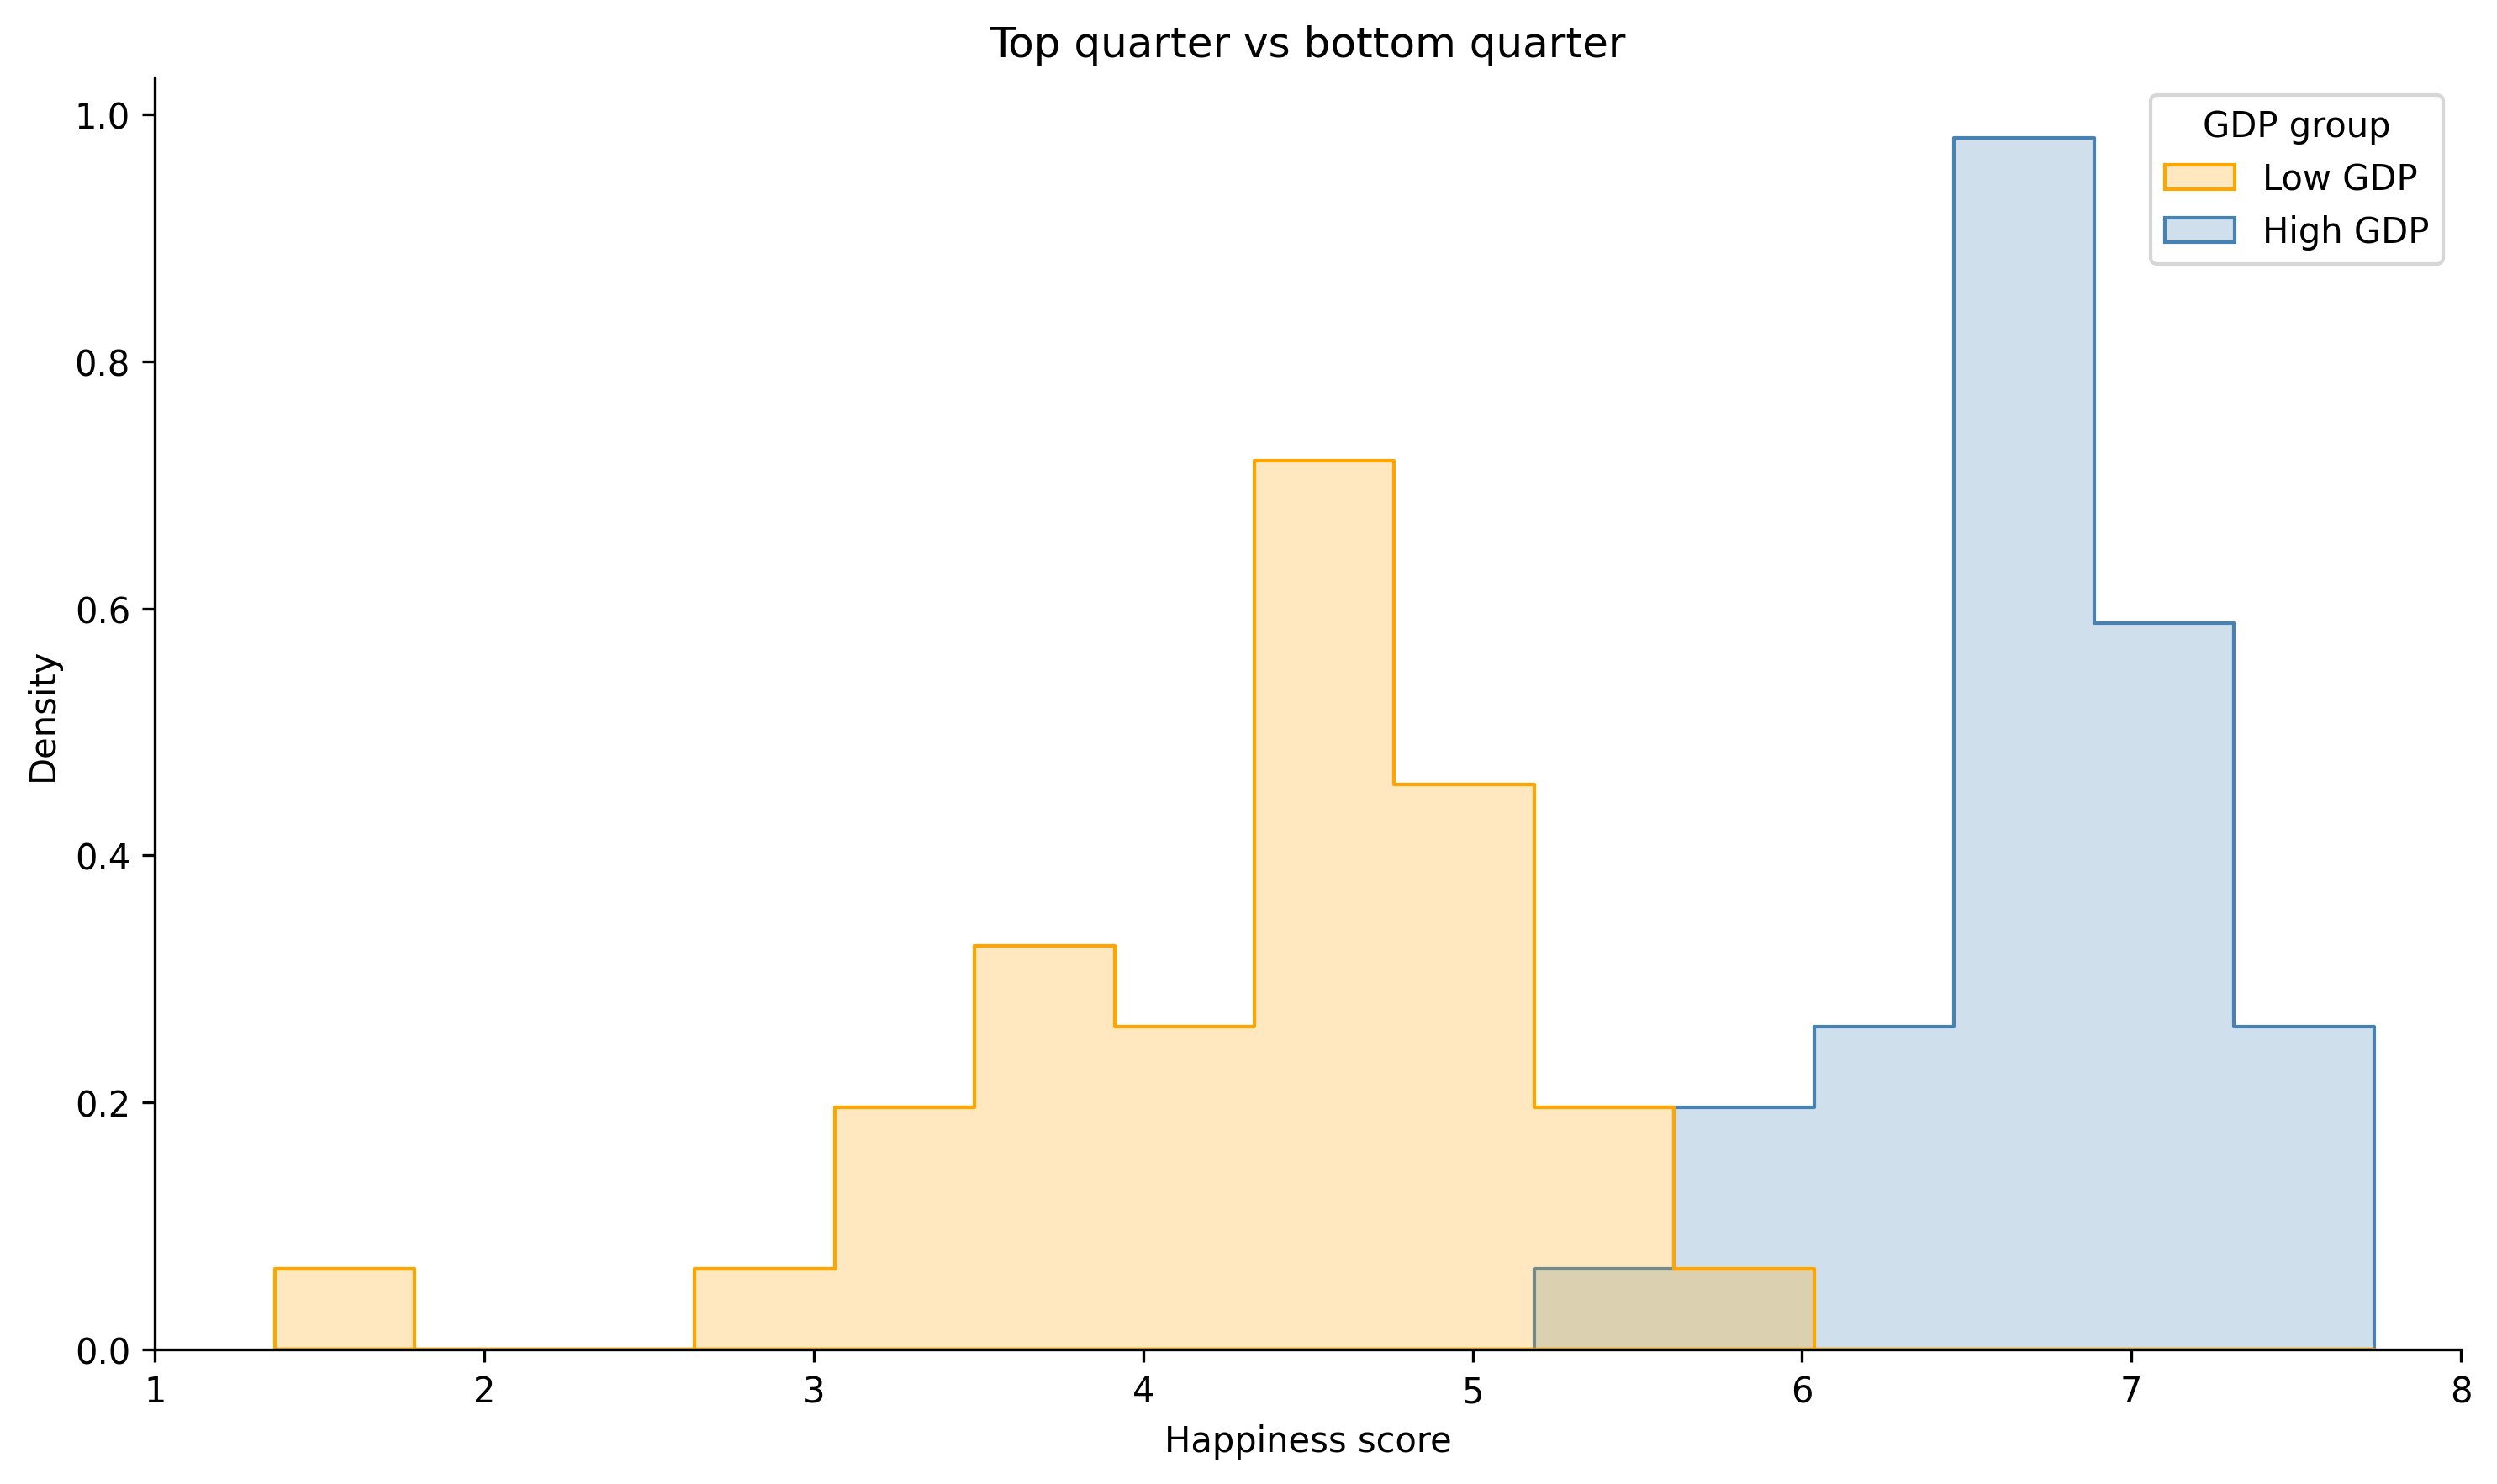
  • Top quarter vs bottom quarter
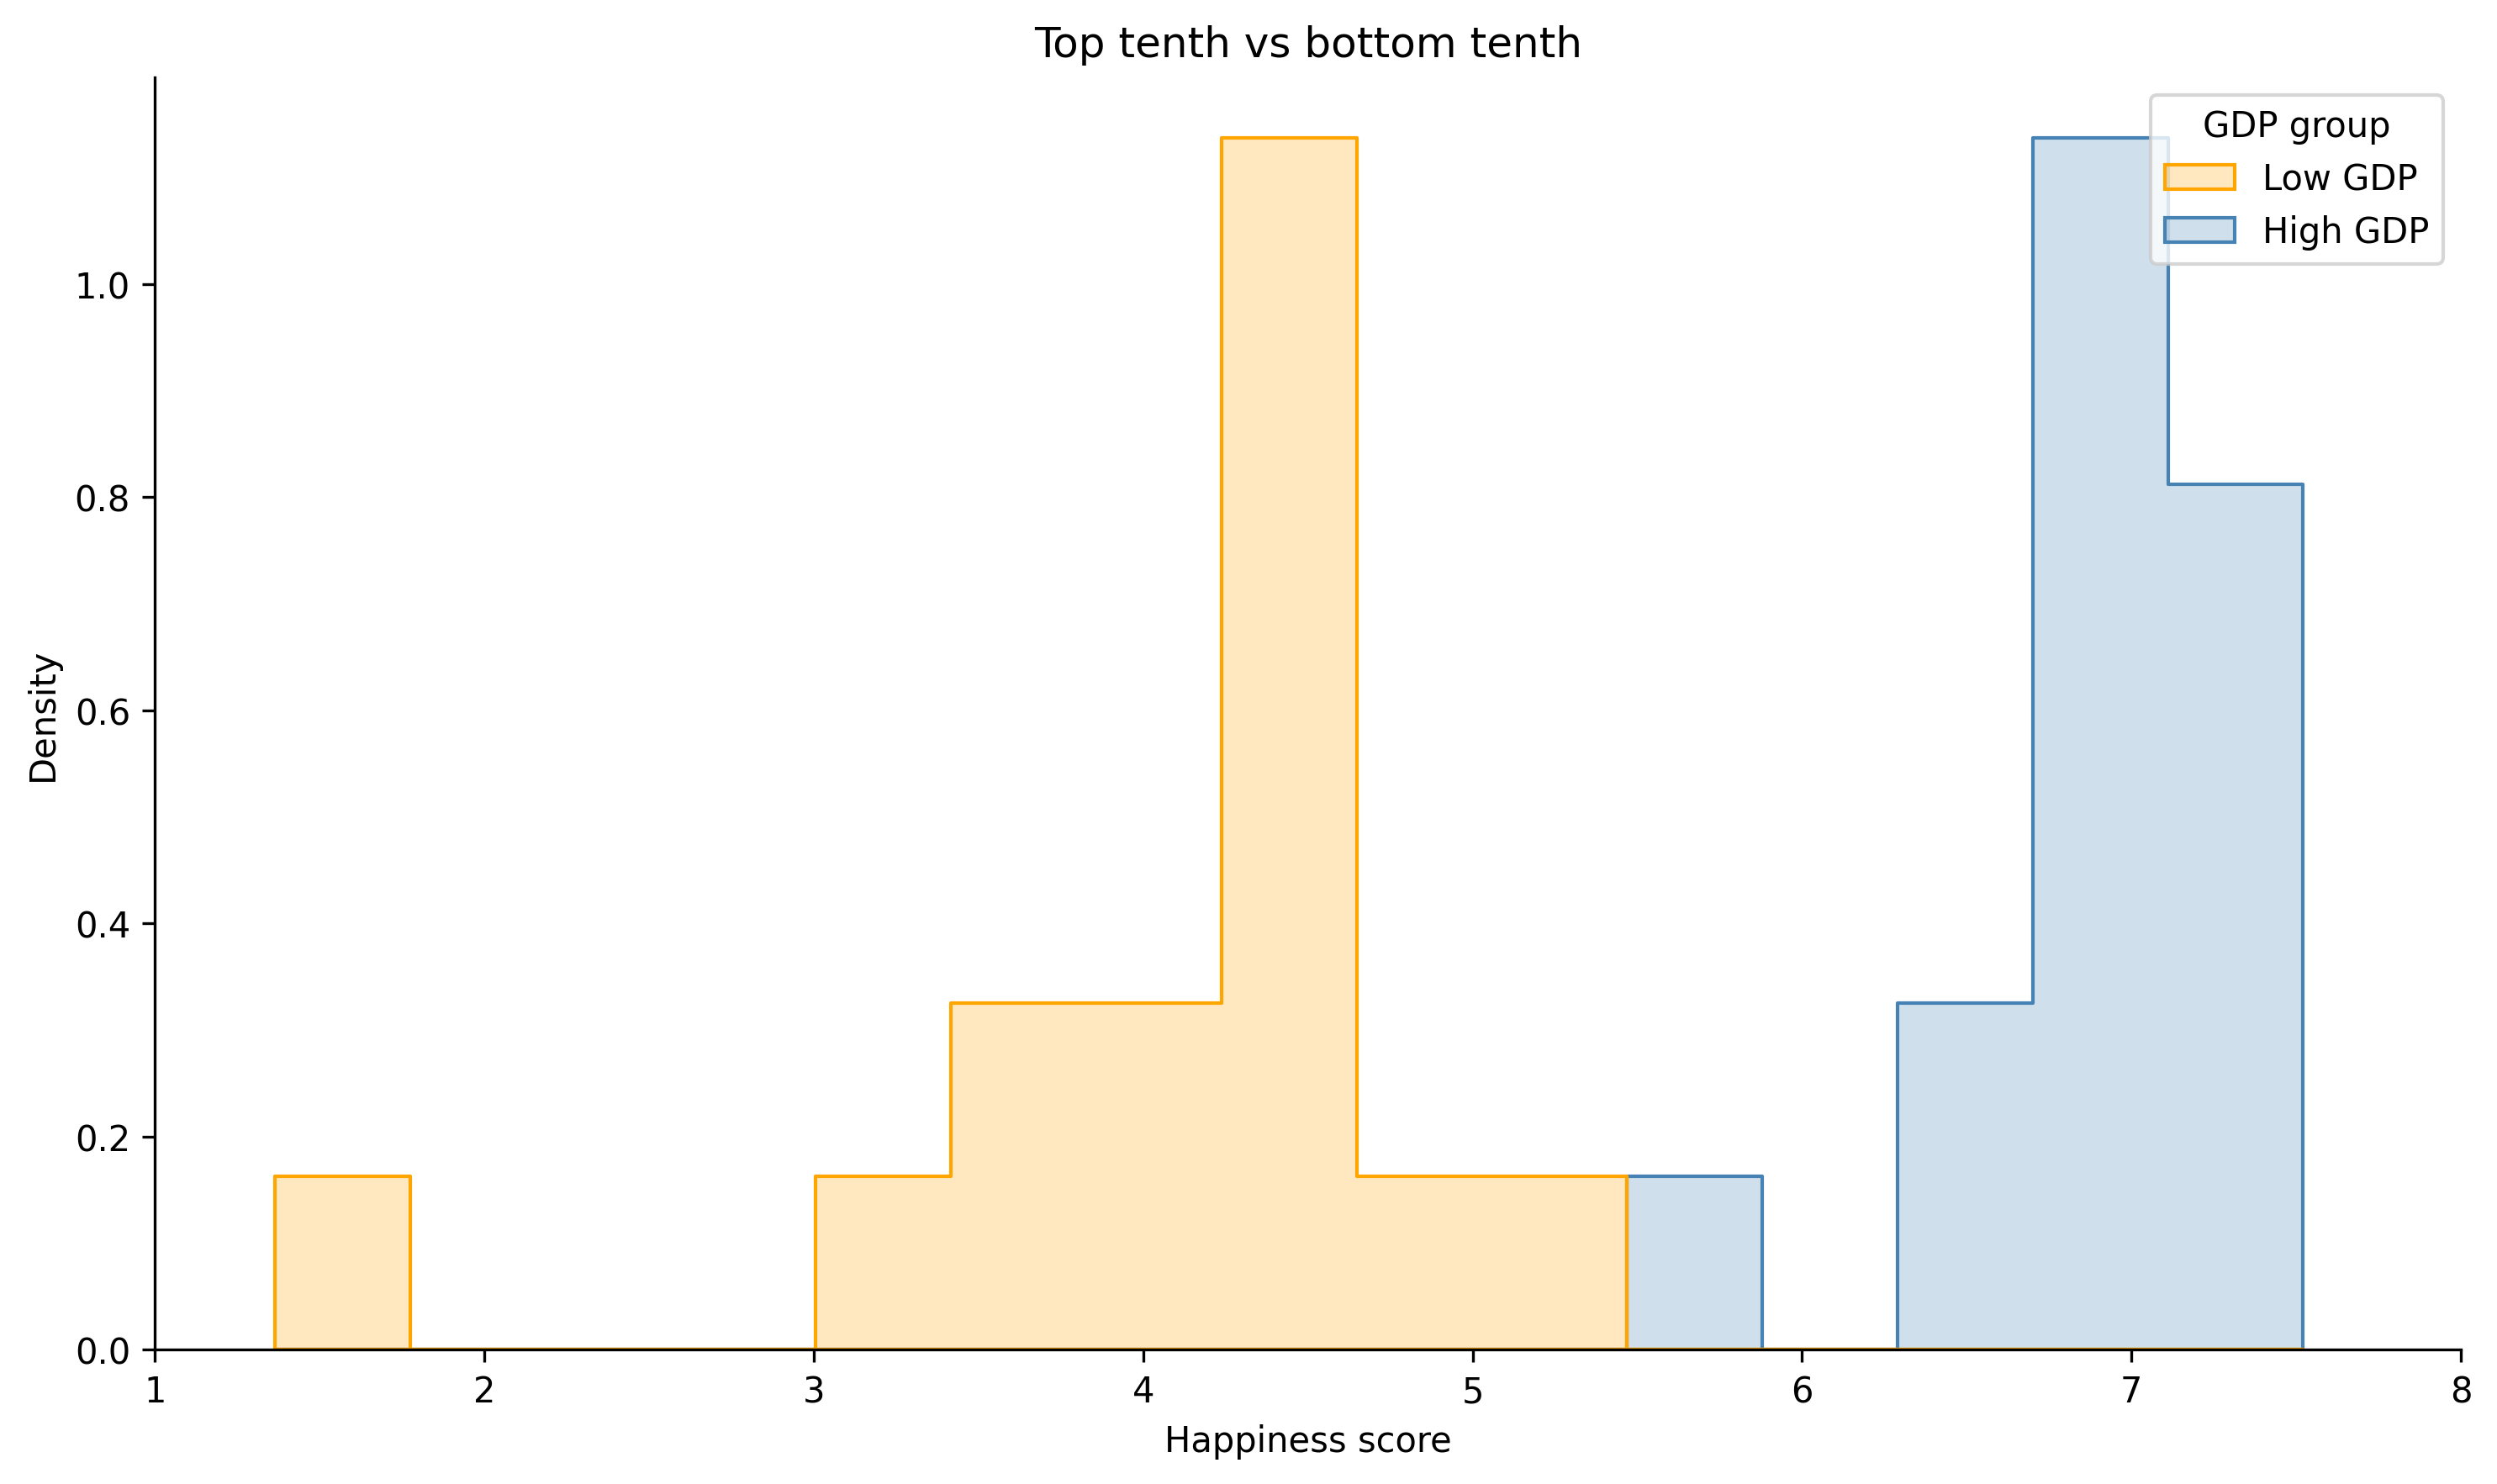
  • Top tenth vs bottom tenth

More extreme comparisons


Rule N high N low Mean high Mean low Gap s.e.(gap)
Richer half vs poorer half 72 72 6.35 4.82 1.53 0.14
Top third vs bottom third 48 48 6.58 4.47 2.11 0.14
Top quarter vs bottom quarter 36 36 6.73 4.33 2.41 0.16
Top tenth vs bottom tenth 15 15 6.88 4.03 2.85 0.26

The humps pull apart, and get bumpier

The humps pull apart, and get bumpier

The humps pull apart, and get bumpier

The humps pull apart, and get bumpier

What each rule throws away

What each rule throws away

What each rule throws away

What each rule throws away

Nothing in the data tells you which cut is correct

Some take-aways

  • We can tell stories with data
  • Visualization is powerful
  • Always explore first

Before you go: forecast your semester

One more portal round, open now


  1. Open your portal link
    https://emiliatjernstrom.com/econ2041/portal.html

    OR scan the QR code, then enter your code
  2. Forecast your own final mark, then judge three hypothetical students


Portal answers are anonymous & ungraded

Results revealed next week

The SES survey

Shapes Macquarie's teaching, support, and services

  • Results affect university rankings, which in turn affects how employers view us... and you!
  • You can win $1,000!
  • Open until 30 August
  • Link in your student email
    (from ses@srcentre.com.au), or scan the code