ECON 2041
Introductory Econometrics
Testing assumptions
Plan for the semester
2 Basic mathematical tools
7 Flavors of OLS & OVB Quiz
10 Inference, continued PS due 16 Oct
12 Measurement error & IRL
Plan for today
- Residual plots: a portal game
- Functional form: happiness and GDP
- Heteroskedasticity: Airbnb prices
- Robust standard errors
A residual is actual Y minus fitted Y
\hat{u}_i = y_i - \hat{y}_i
Plot the residuals against the fitted values \hat{y}_i
What we want to see: pure noise
Open the portal on your phone
On the next slide: 4 residual plots
Tick every plot whose residuals look like pure noise
https://emiliatjernstrom.com/econ2041/portal.html
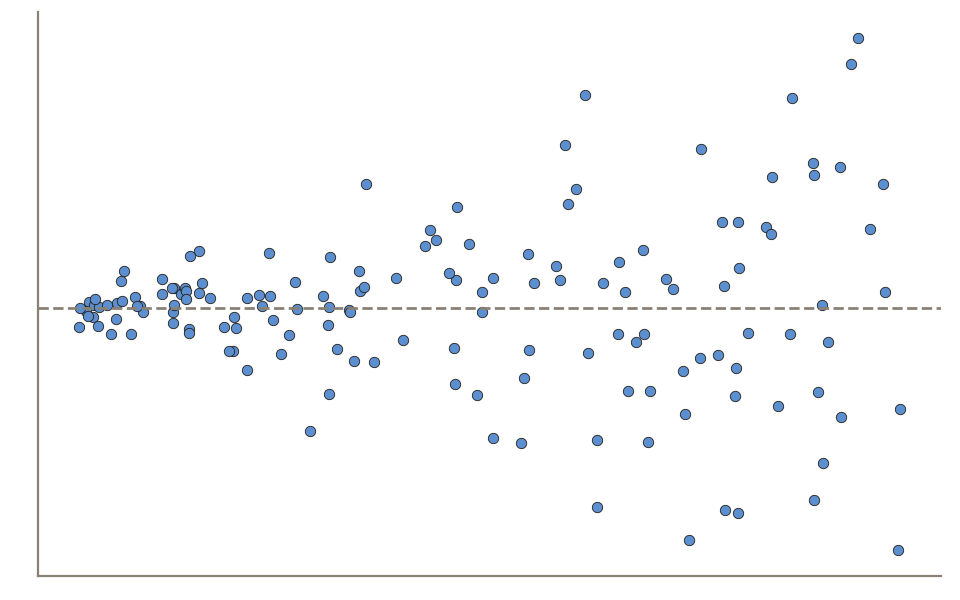
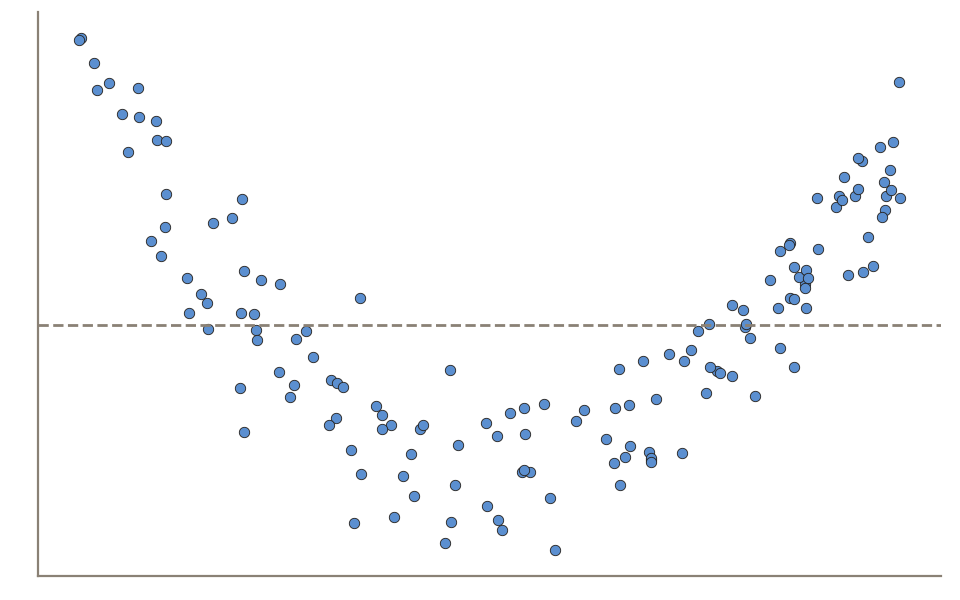
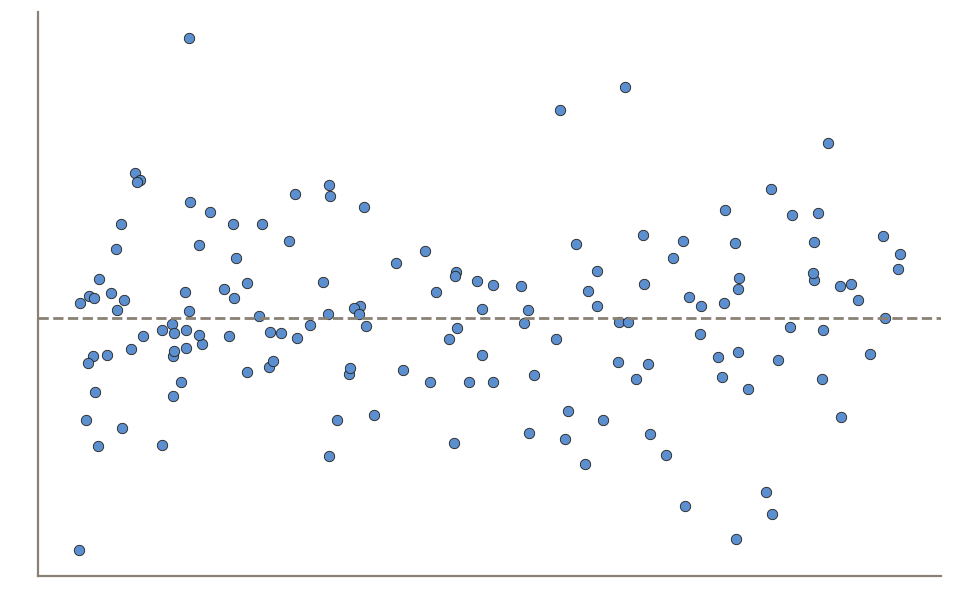
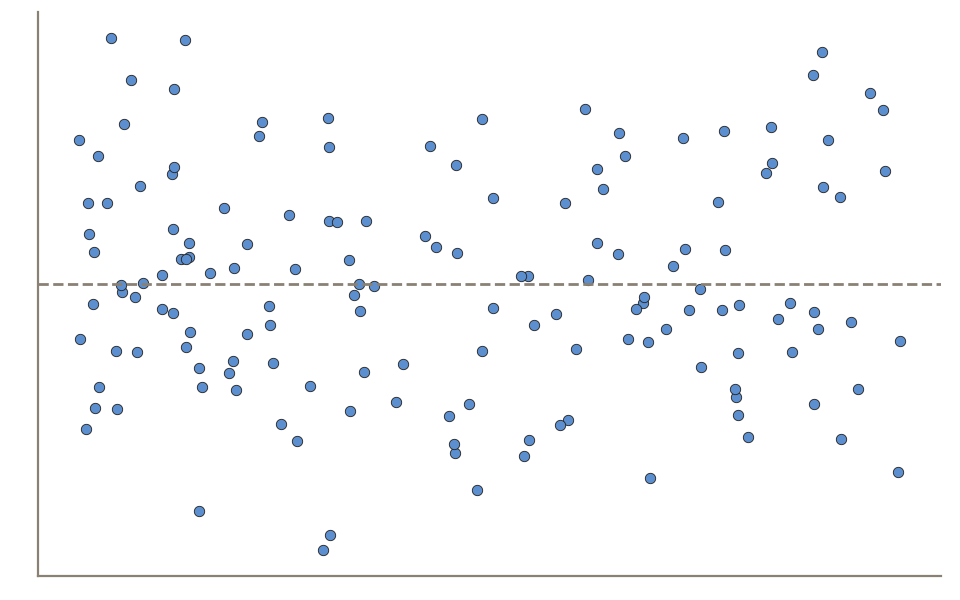
In which plots are the residuals pure noise?
A: unequal residual variance
![]()
C: a curved pattern
![]()
B: pure noise
![]()
D: pure noise
![]()
Vote on the portal: https://emiliatjernstrom.com/econ2041/portal.html
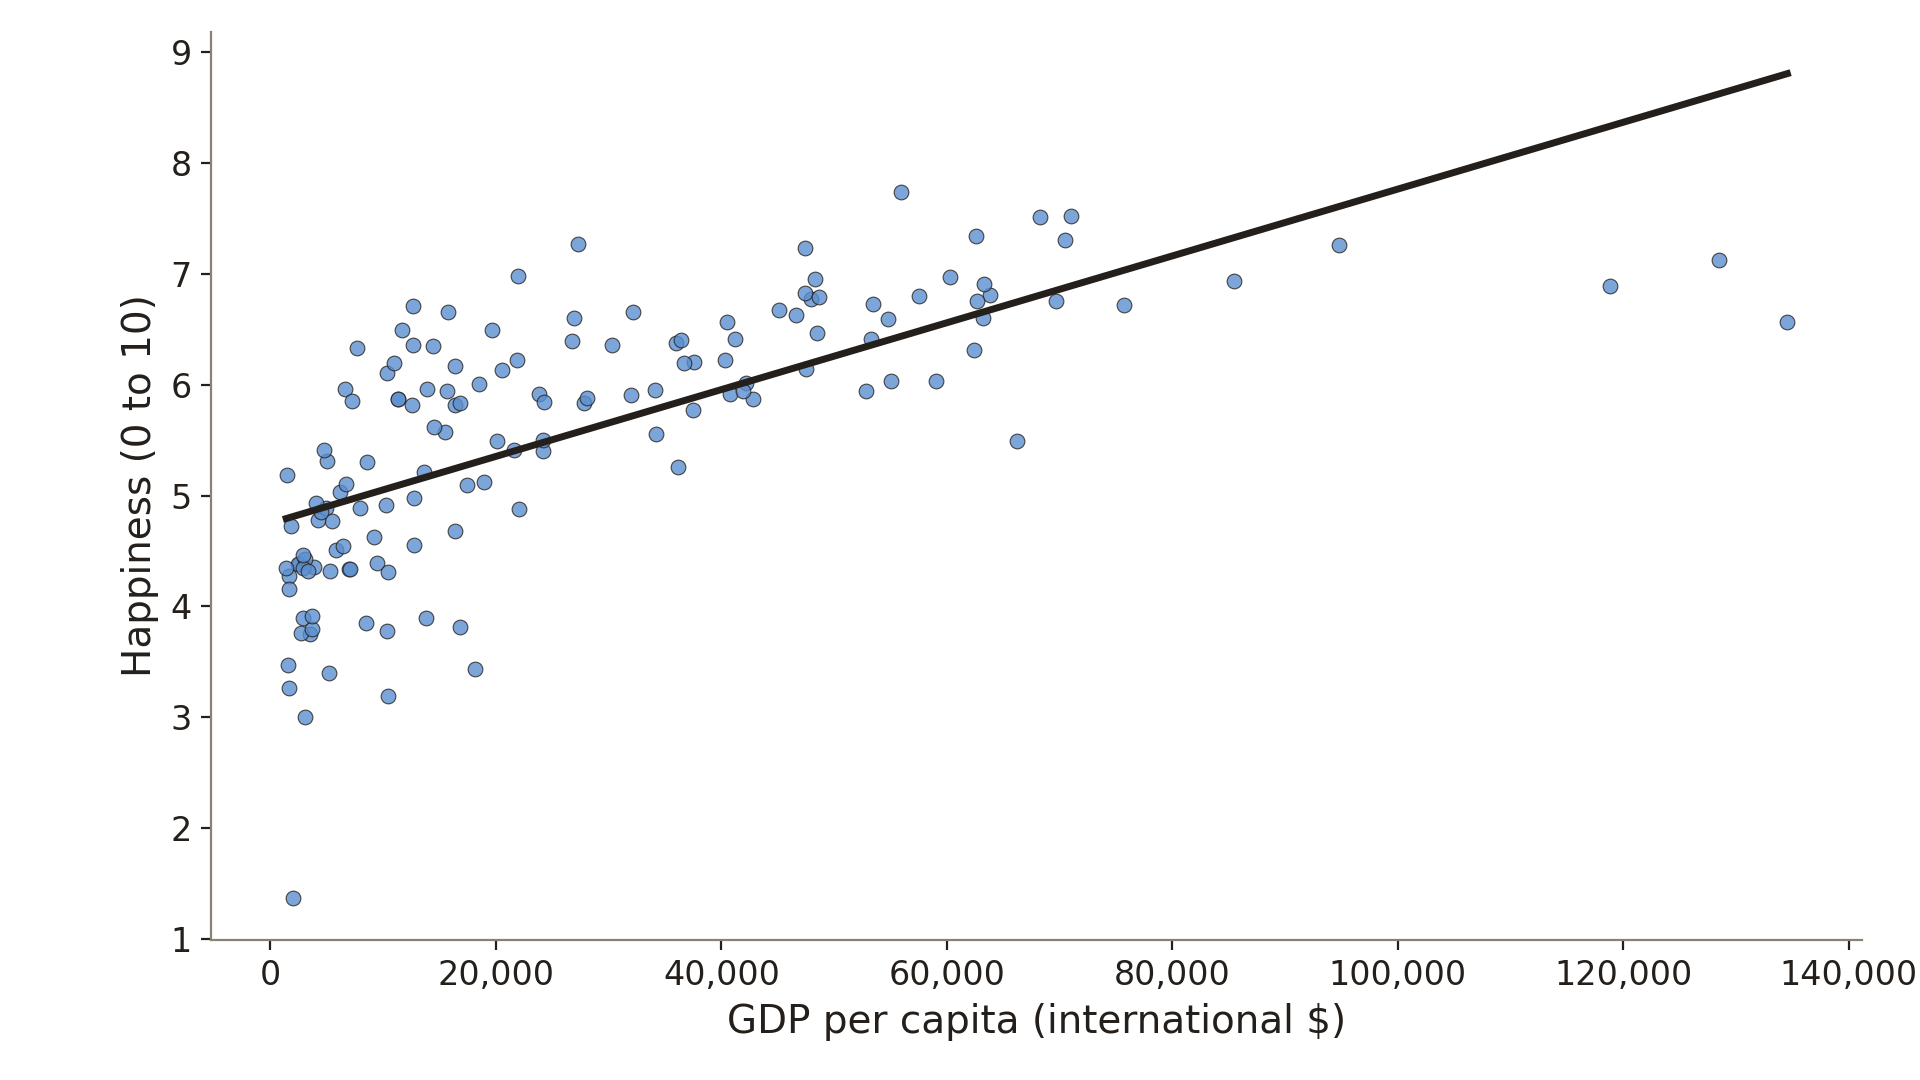
Is happiness linear in GDP?
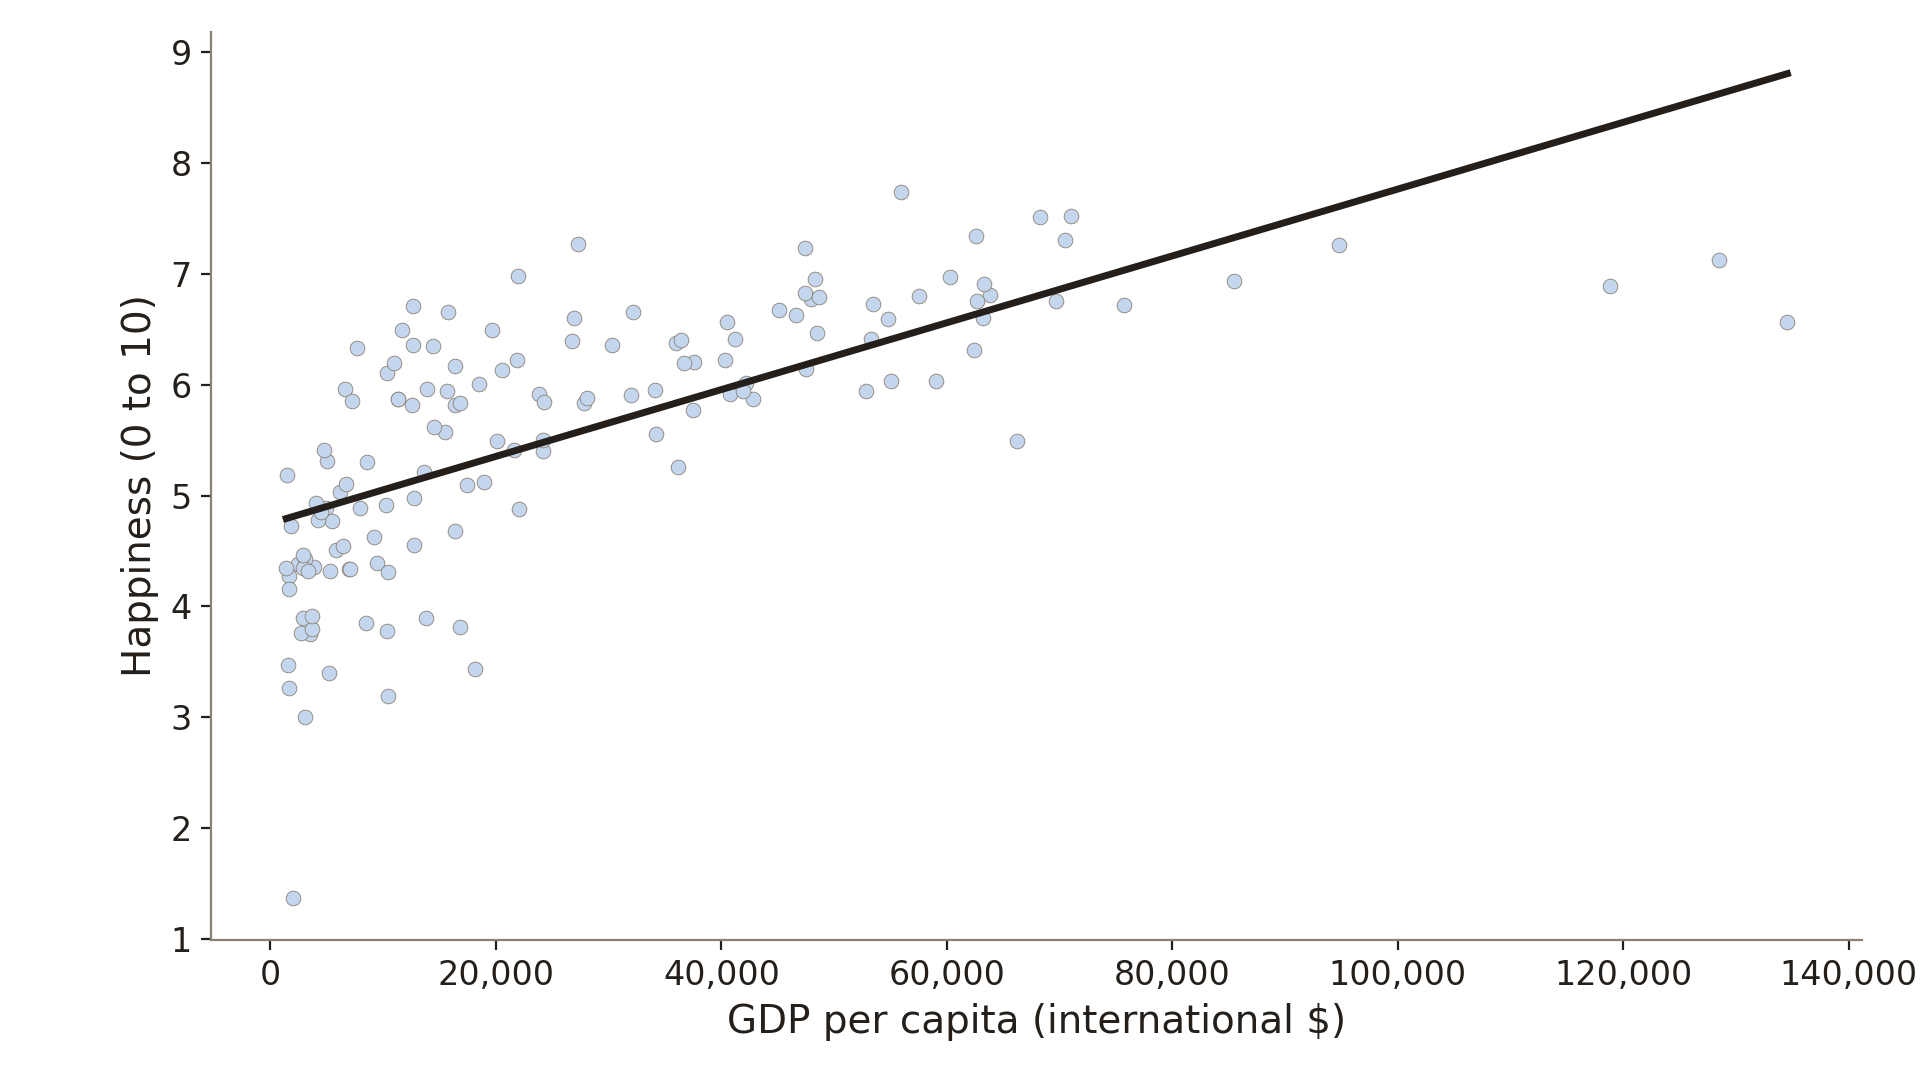
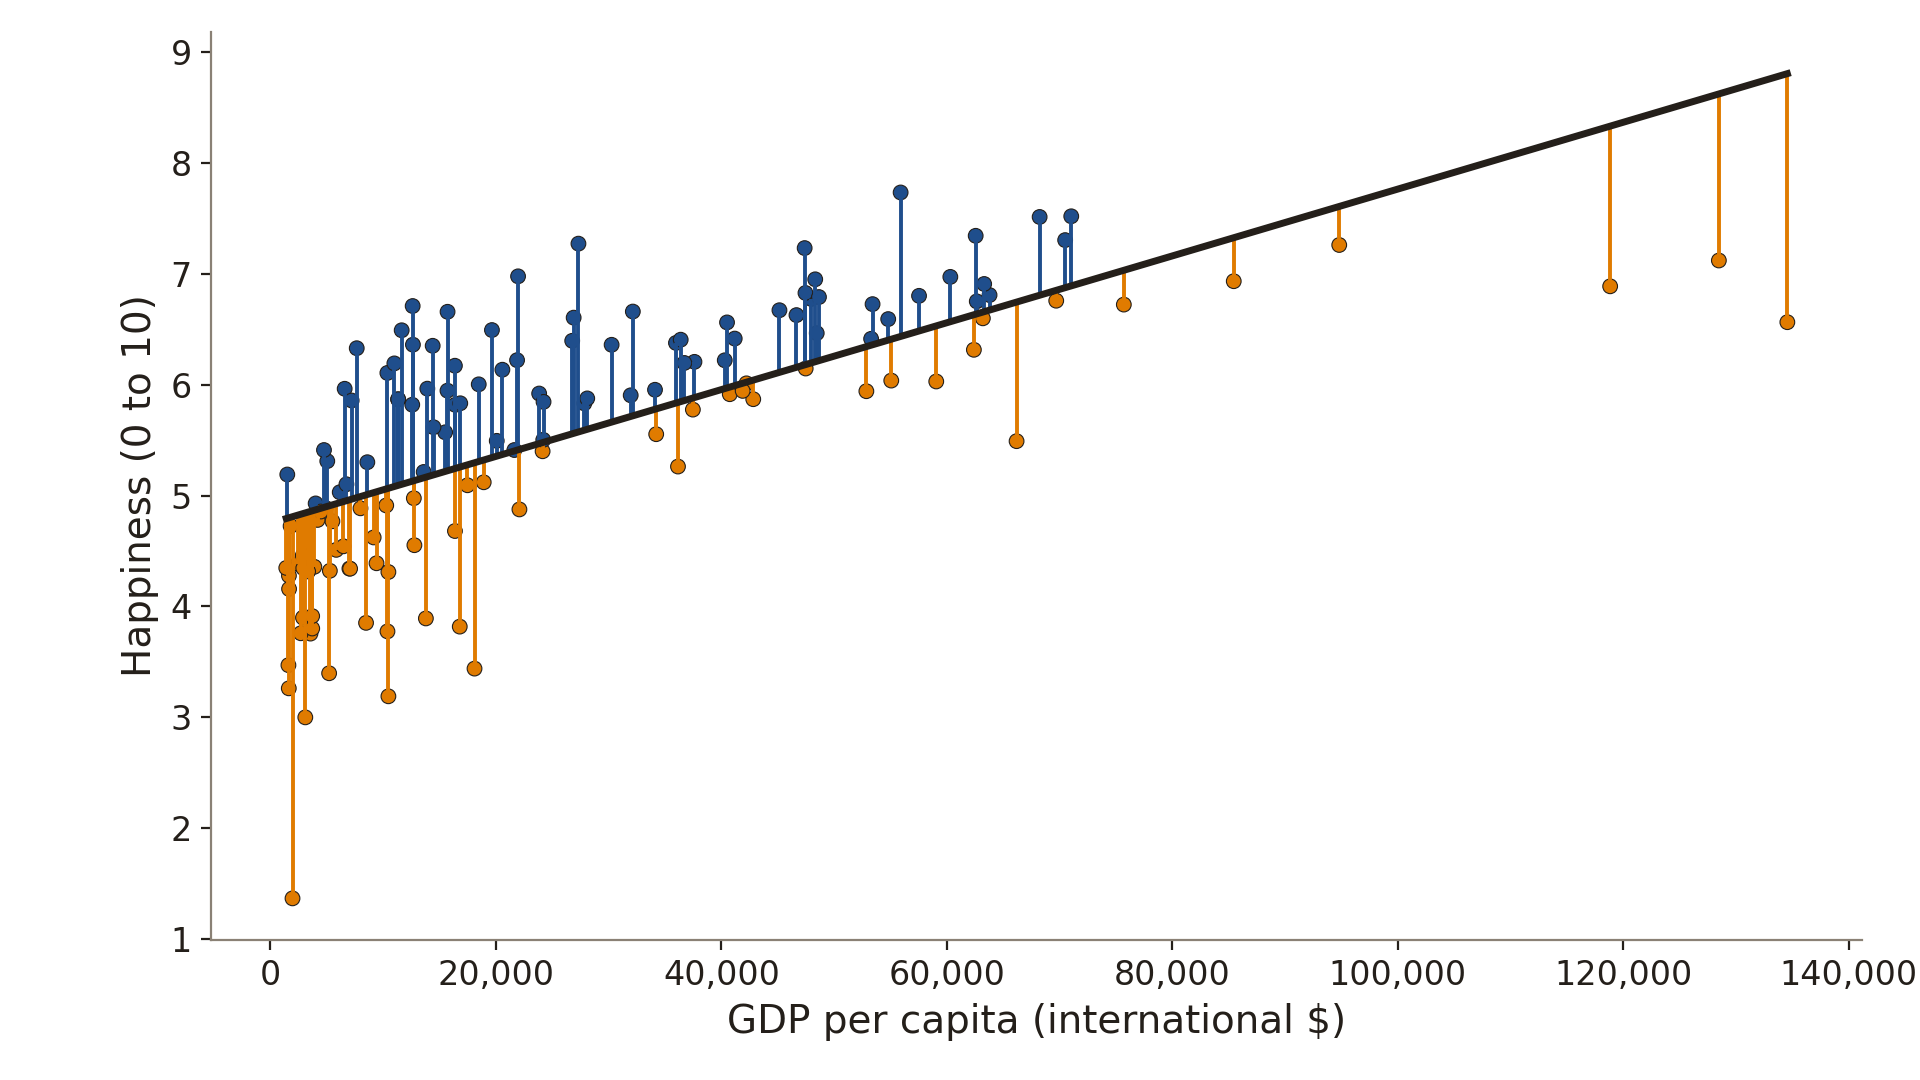
Richer countries are happier
\widehat{\text{happiness}} = 4.75 + 0.03 \times \text{GDP per capita (\$1,000s)}
Data: Gallup World Poll & World Bank, via Our World in Data; 144 countries, 2024
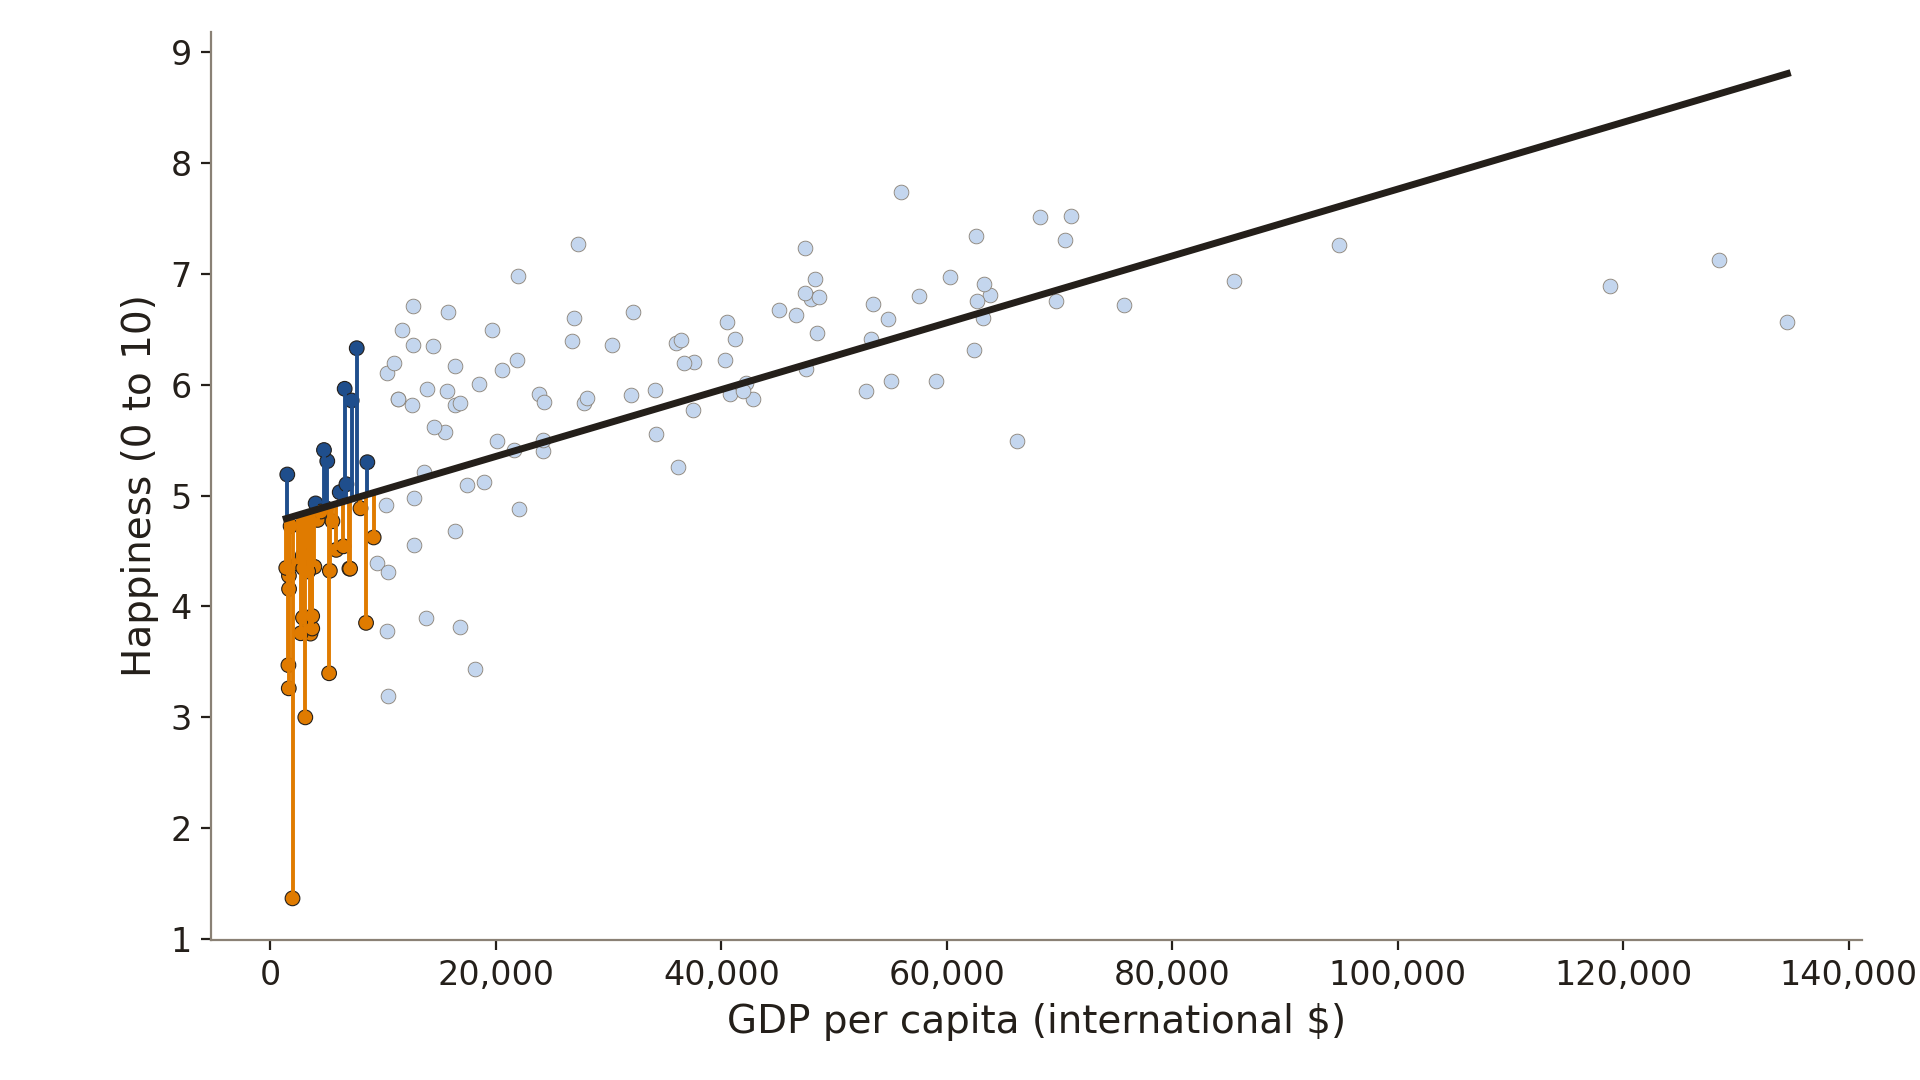
Residuals: negative, positive, then negative
Data: Gallup World Poll & World Bank, via Our World in Data; 144 countries, 2024
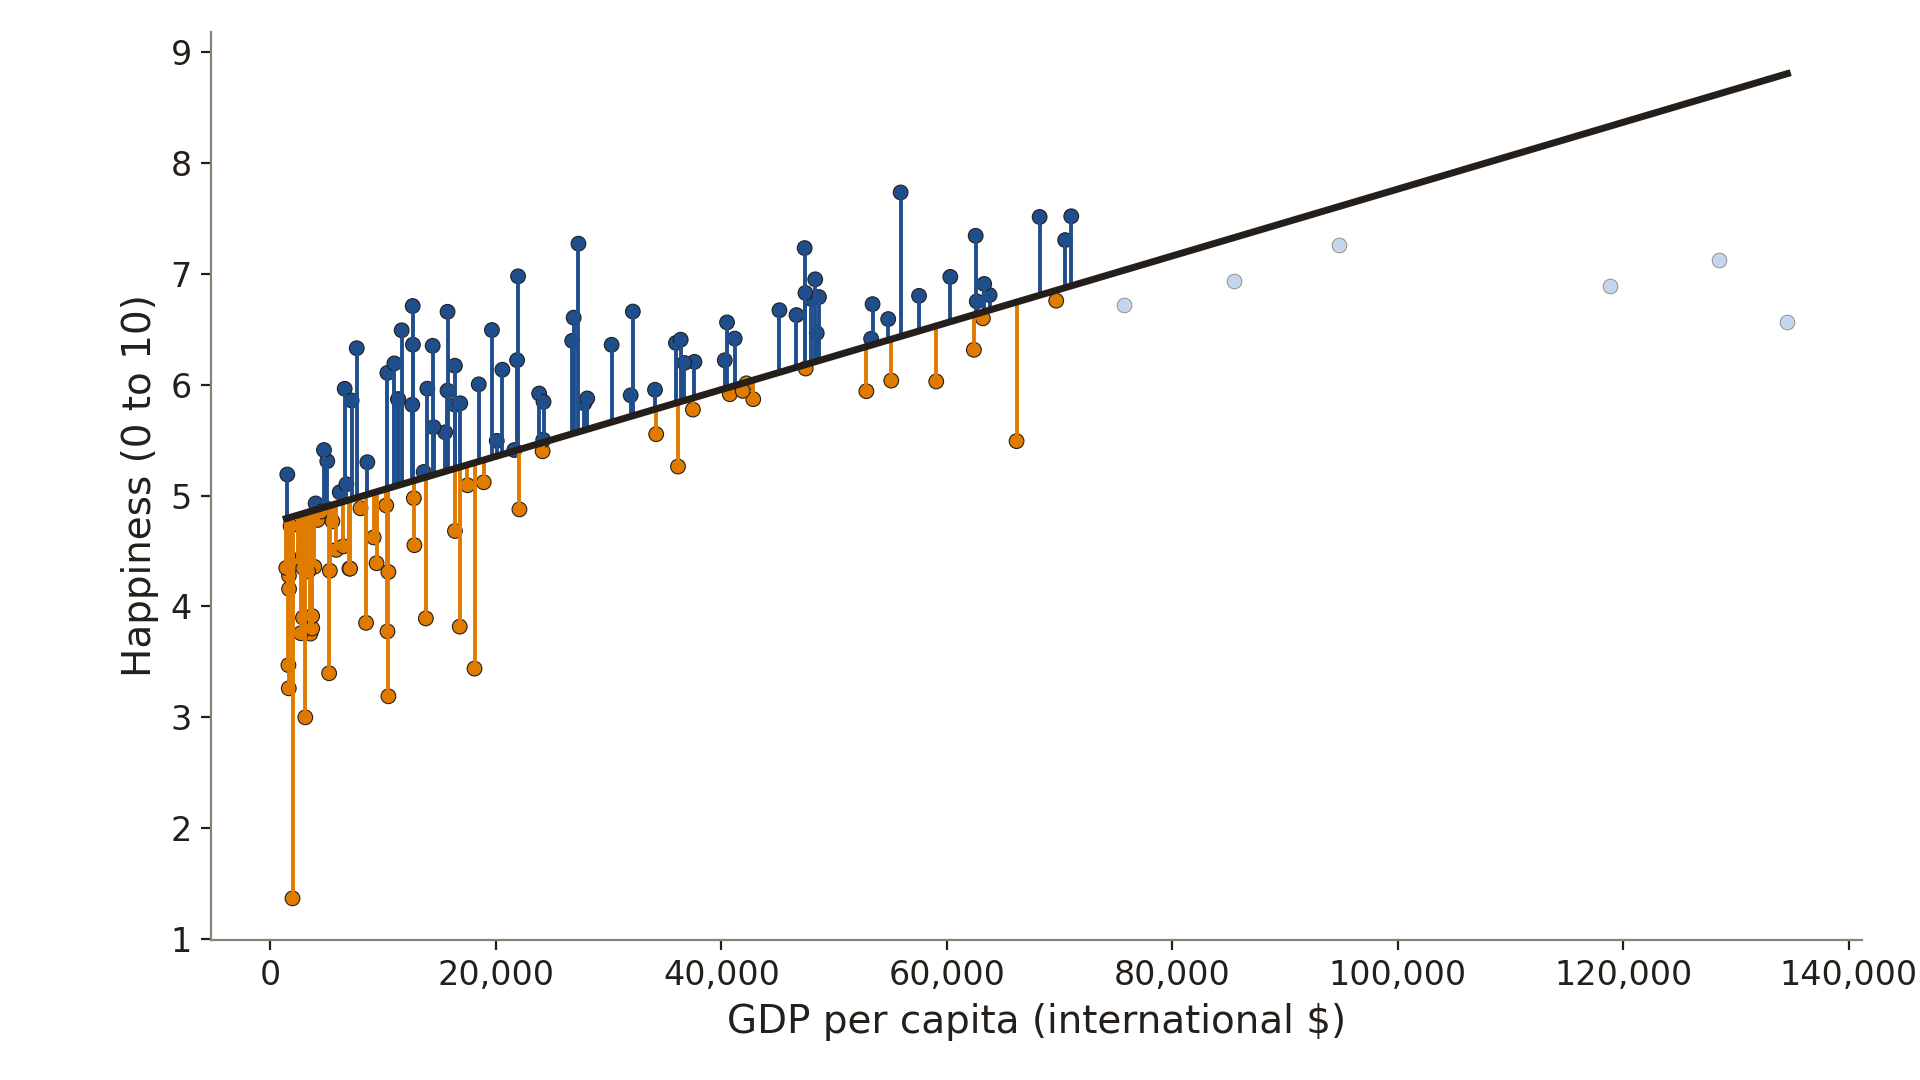
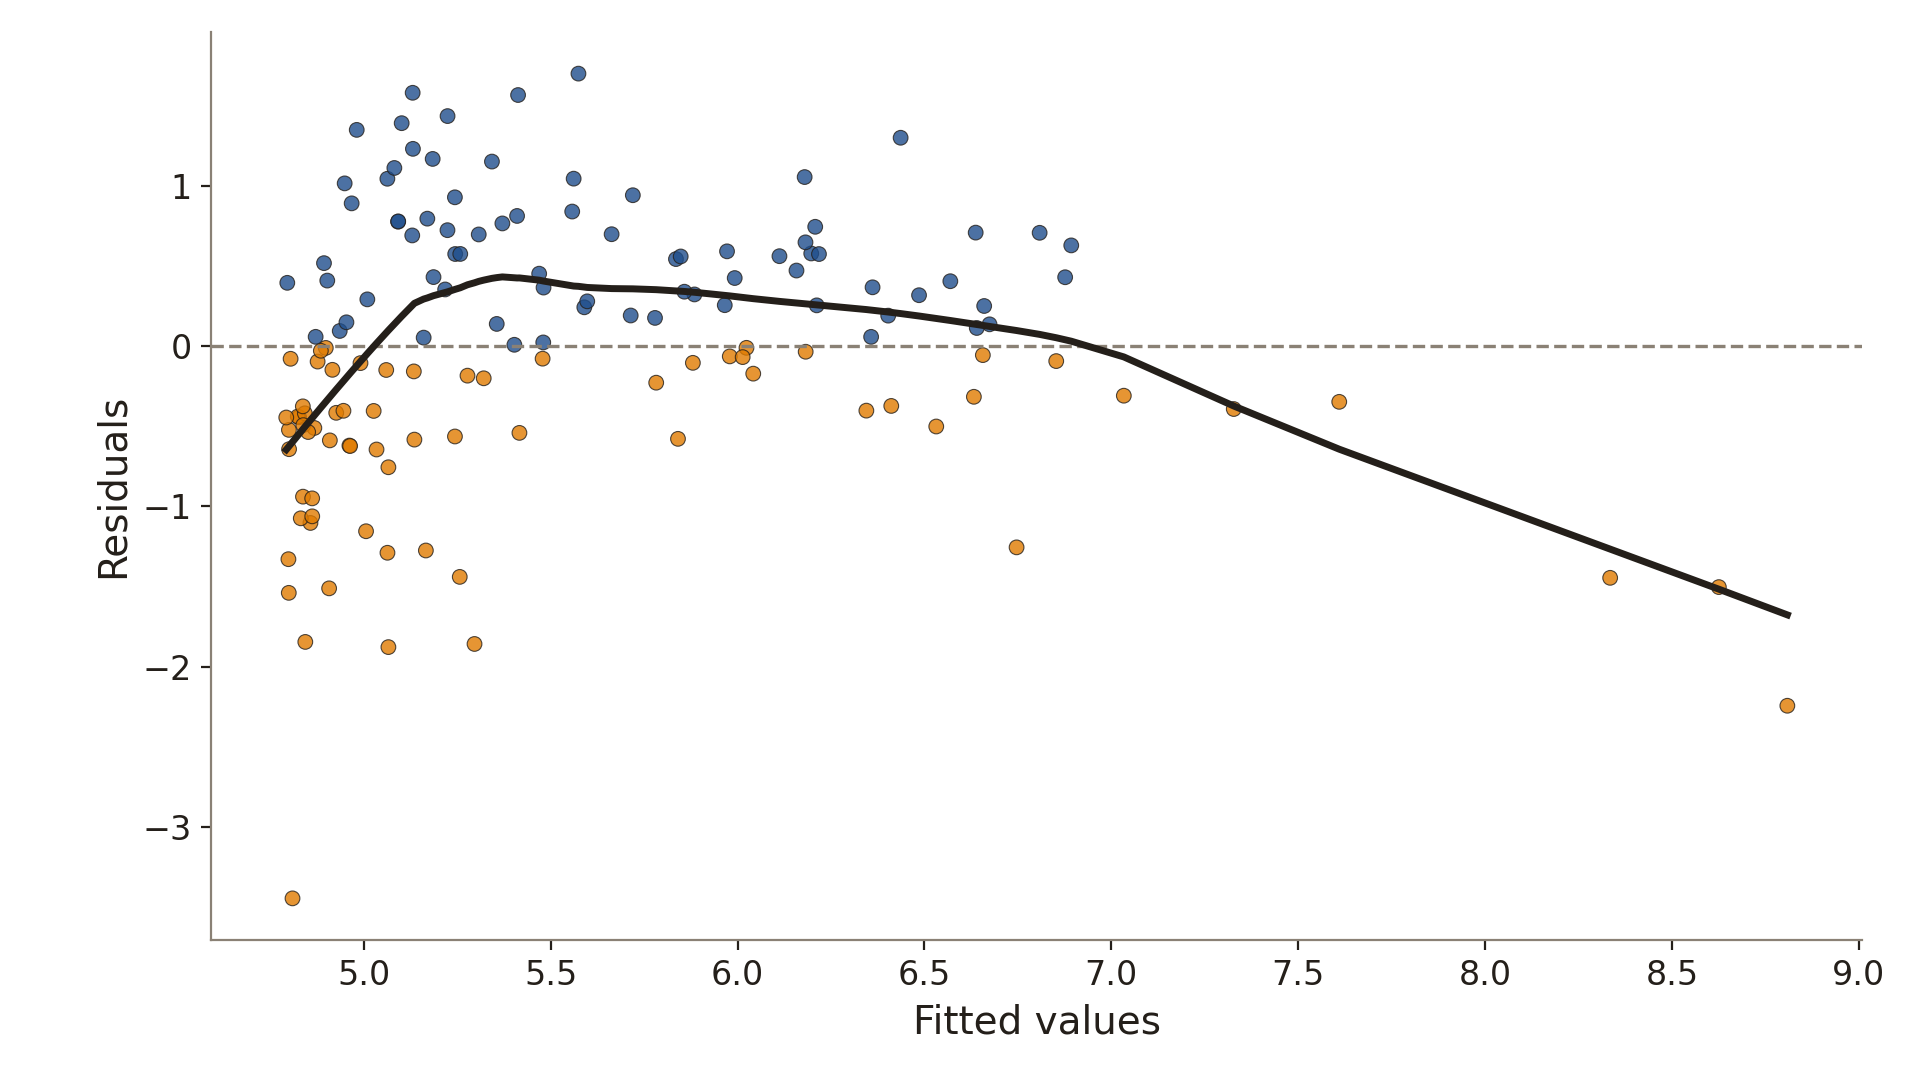
A curved pattern in the residual plot
Data: Gallup World Poll & World Bank, via Our World in Data; 144 countries, 2024
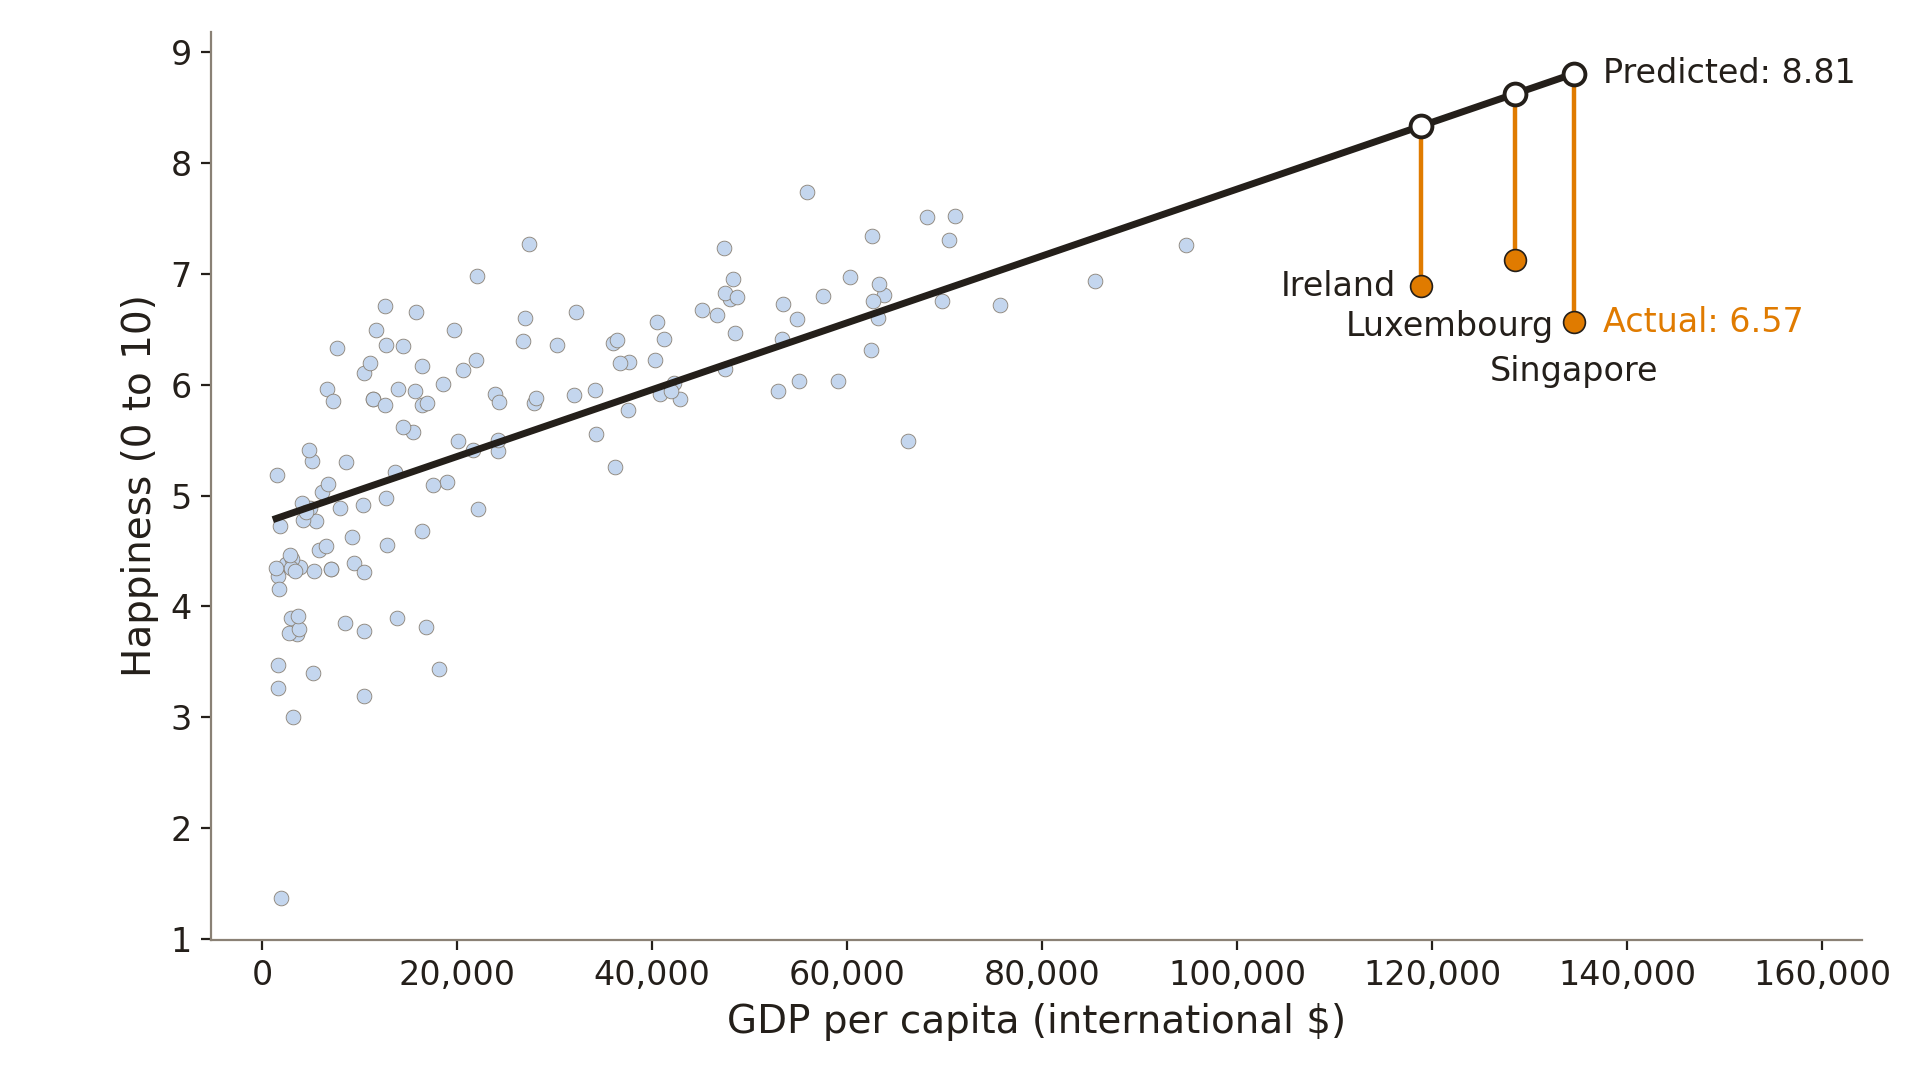
Richest countries: below their fitted values
Data: Gallup World Poll & World Bank, via Our World in Data; 144 countries, 2024
We reject linearity with the RESET test
from statsmodels.stats.diagnostic import linear_reset

model = ols("happiness ~ gdp_k", data=happy).fit()
linear_reset(model, power=3, use_f=True)
<F test: F=25.21835447783917, p=4.430122822451849e-10, df_denom=140, df_num=2>
p is below 0.1, so we reject the null that the coefficients on the squared and cubed fitted values are both 0
Data: Gallup World Poll & World Bank, via Our World in Data; 144 countries, 2024
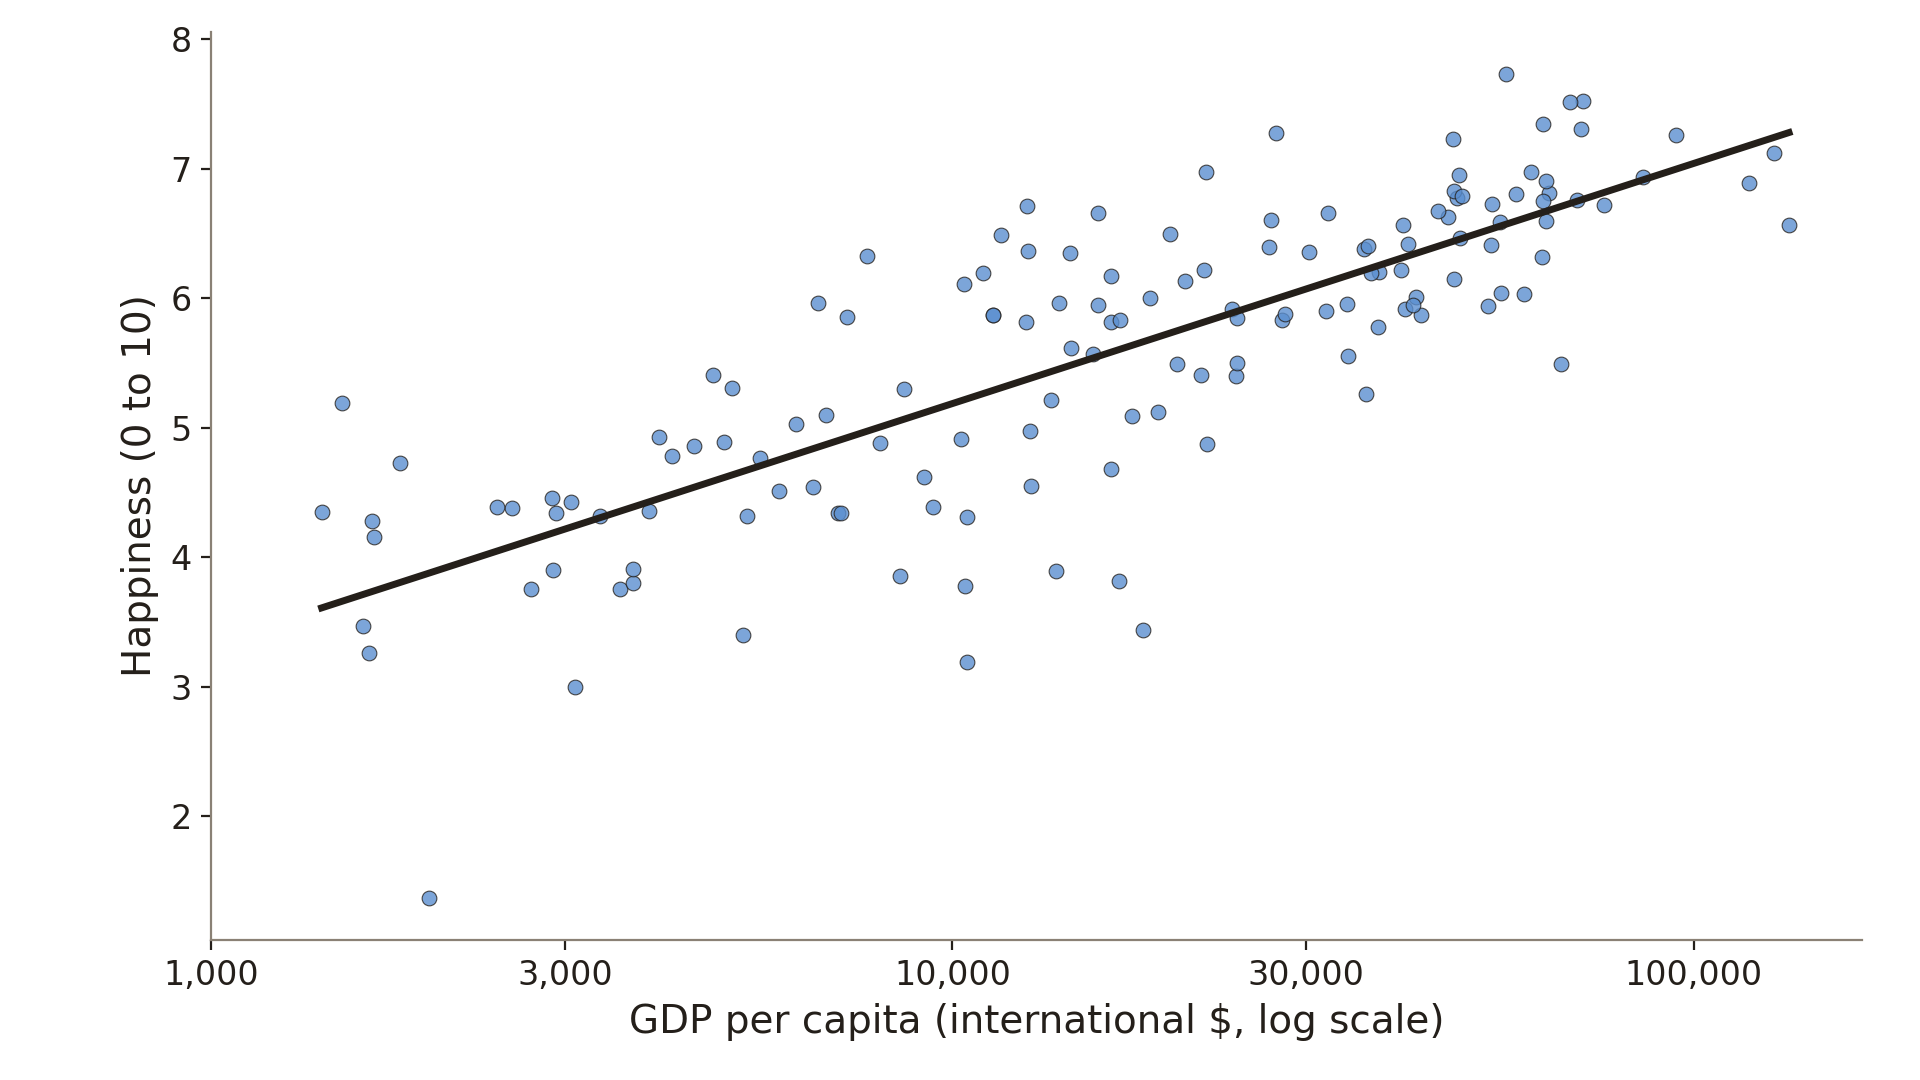
Logging GDP improves the functional form
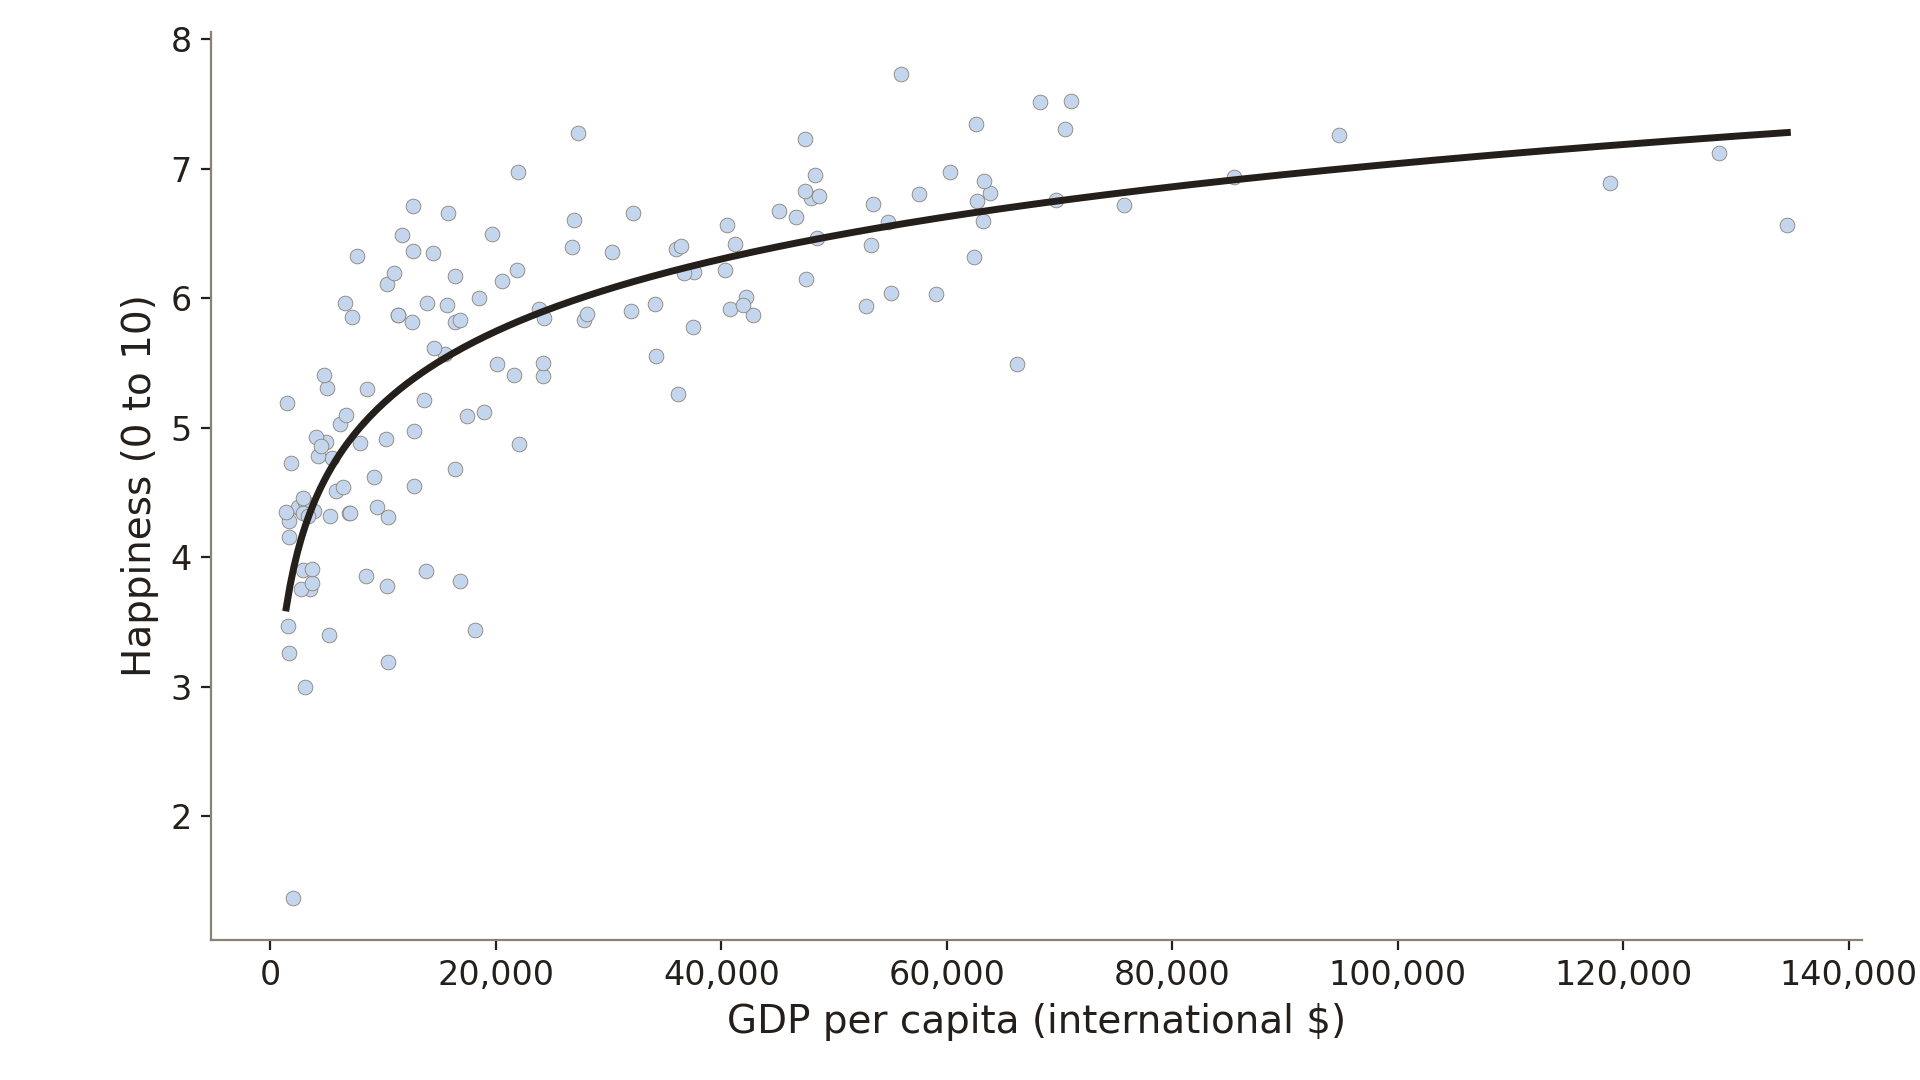
\widehat{\text{happiness}} = -2.23 + 0.81 \times \log(\text{GDP per capita})
Data: Gallup World Poll & World Bank, via Our World in Data; 144 countries, 2024
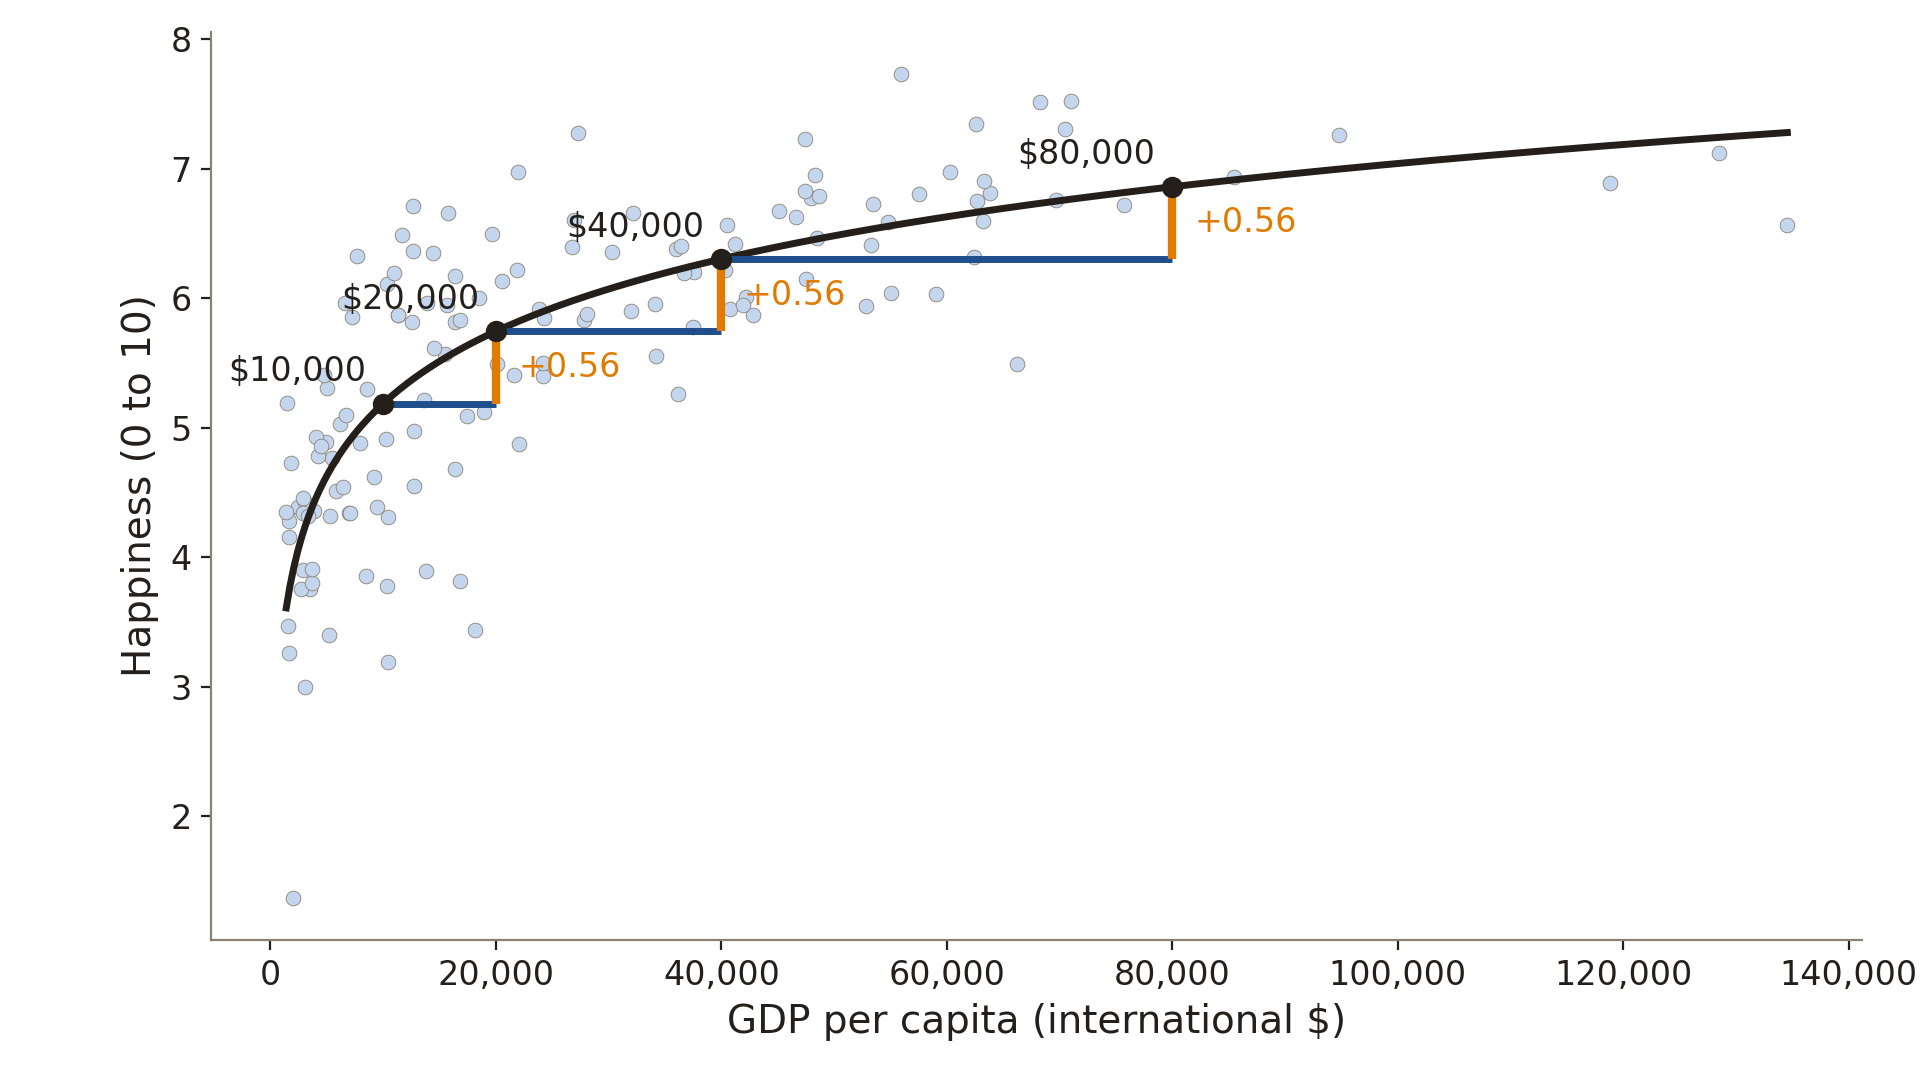
Each doubling of GDP: same fitted difference
Data: Gallup World Poll & World Bank, via Our World in Data; 144 countries, 2024
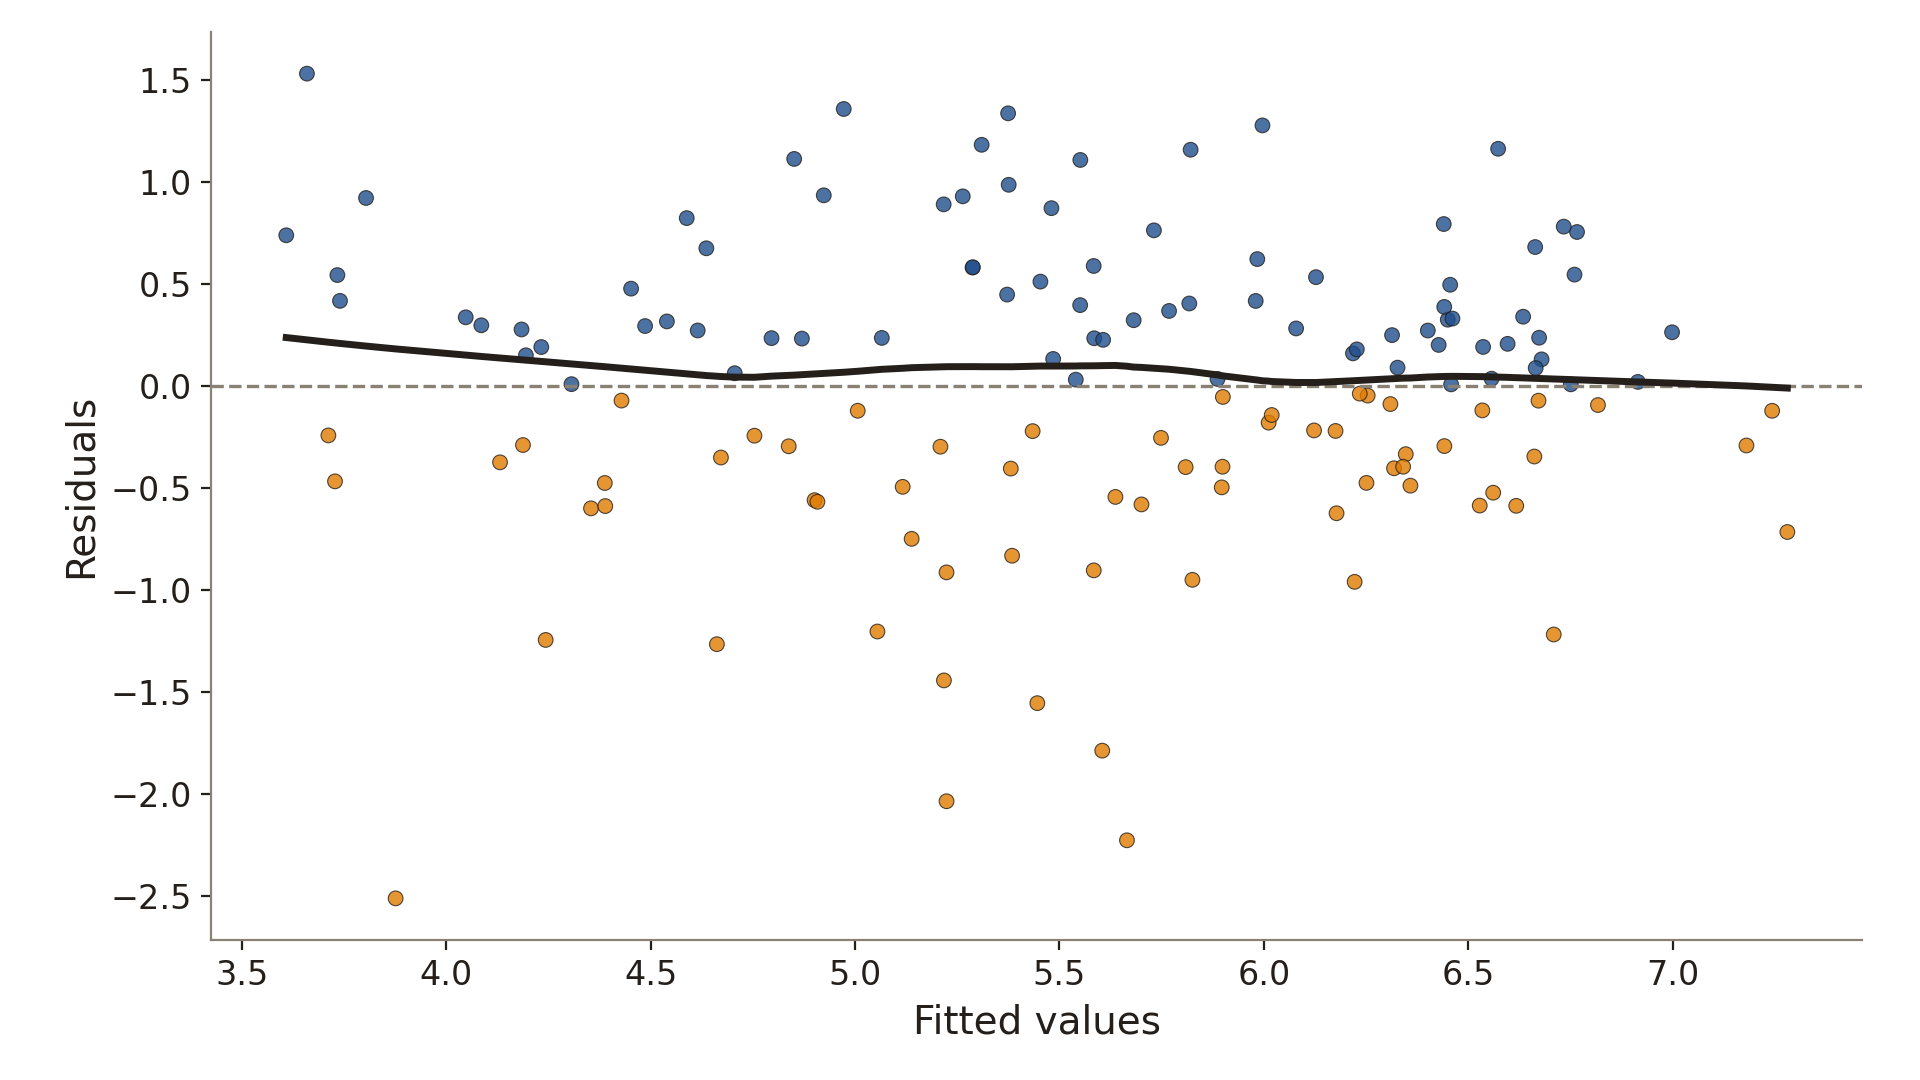
With log GDP, no pattern in the residuals
RESET: F = 0.76, p = 0.47
Data: Gallup World Poll & World Bank, via Our World in Data; 144 countries, 2024
Heteroskedasticity in Airbnb
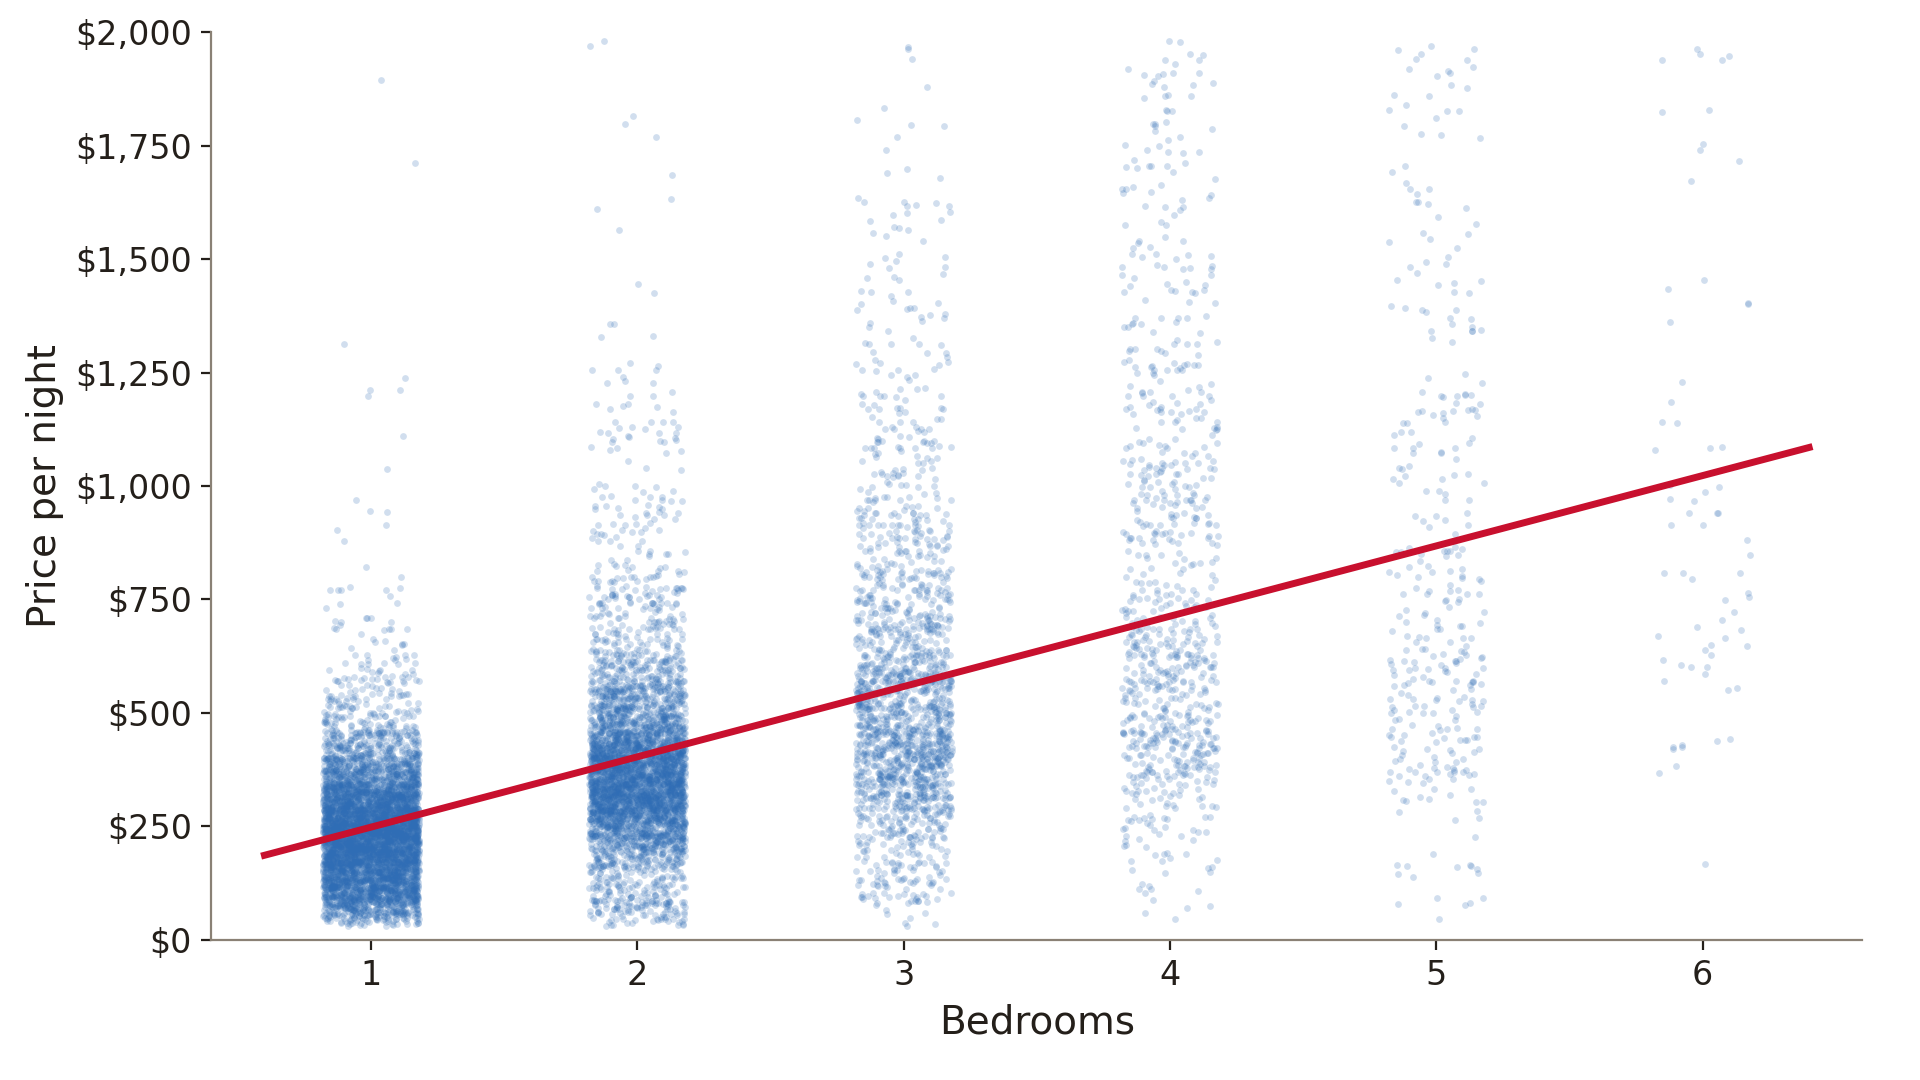
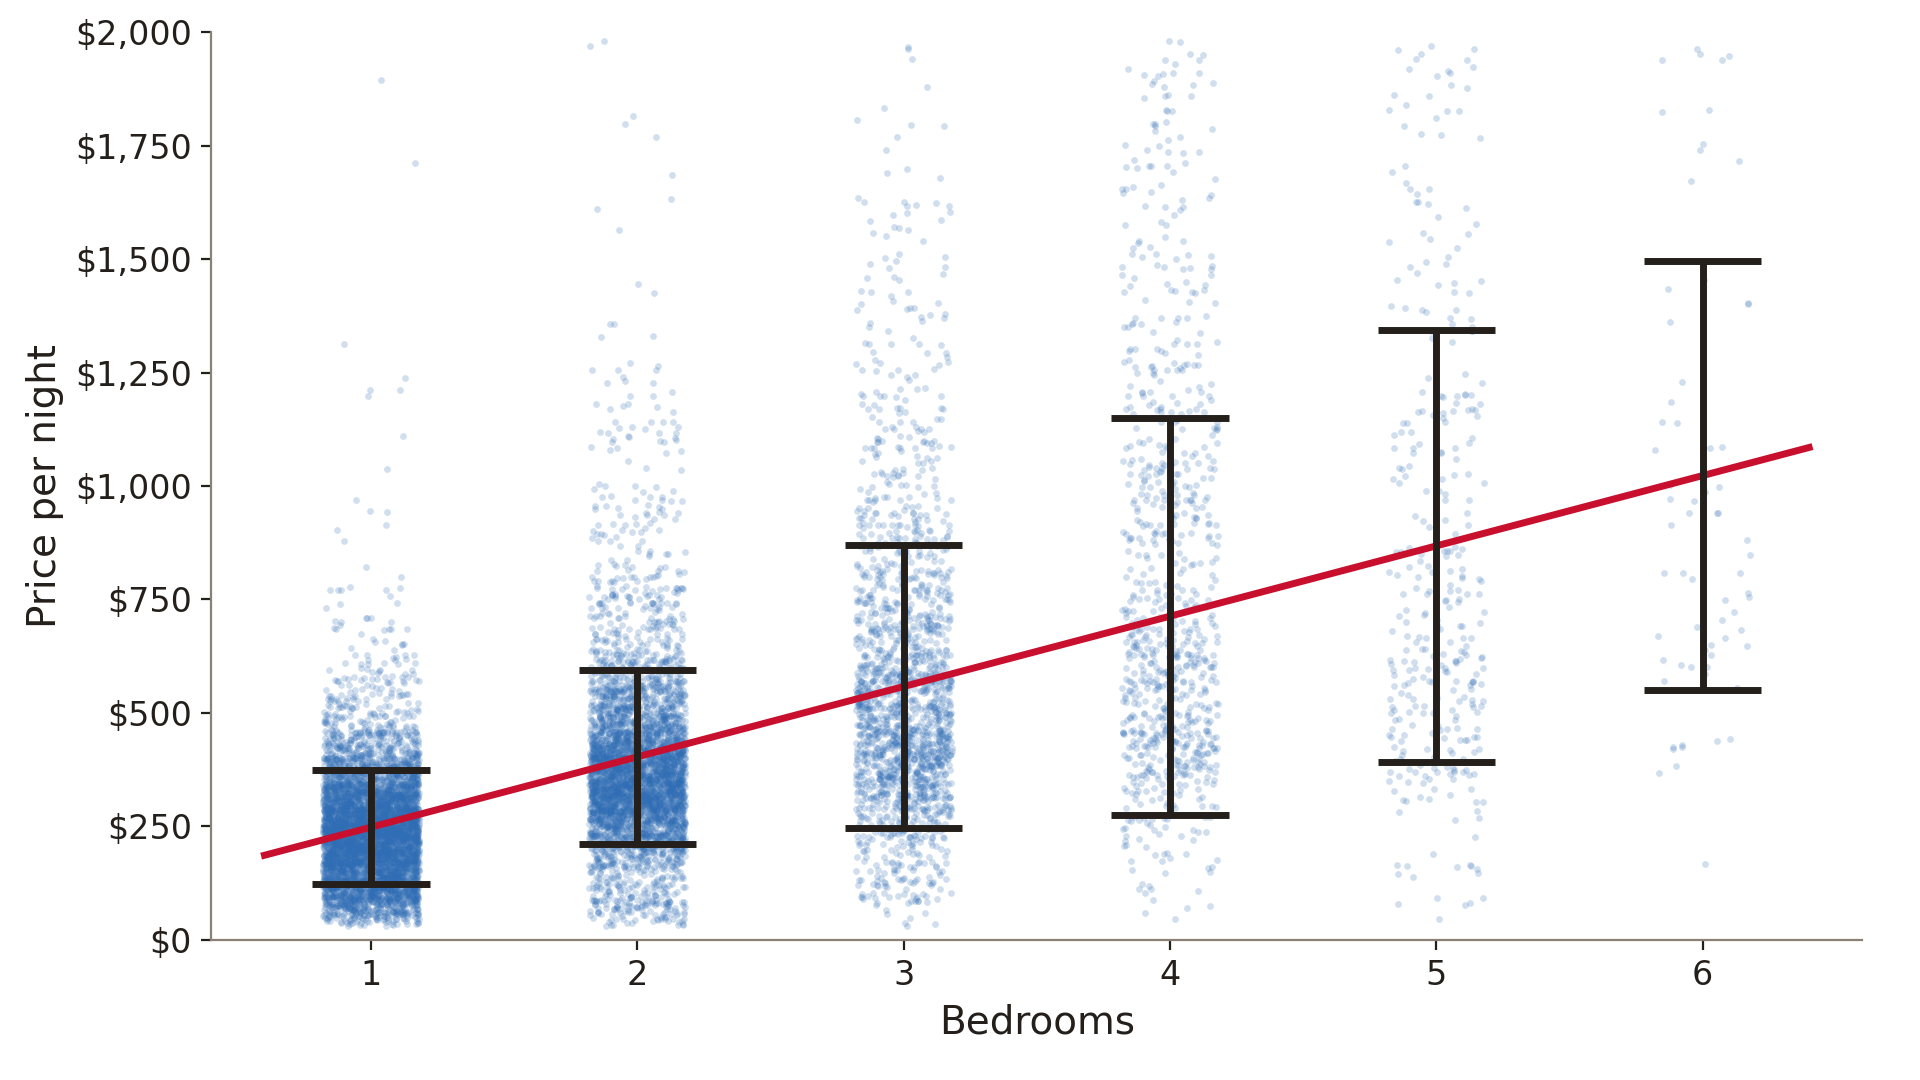
Residual variance is larger for bigger listings
\widehat{\text{price}} = 92.89 + 155.01 \times \text{bedrooms}
Data: Inside Airbnb, Sydney, snapshot of 16 June 2026; 12,419 listings; the 99.8% with up to 6 bedrooms are shown
Breusch-Pagan: regress squared residuals on X
from statsmodels.stats.diagnostic import het_breuschpagan

model = ols("price ~ bedrooms", data=airbnb).fit()
bp = het_breuschpagan(model.resid, model.model.exog)
print("LM statistic:", round(bp[0], 1))
print("p-value:", round(bp[1], 4))
LM statistic: 1769.0
p-value: 0.0
p is below 0.1, so we reject the null of homoskedasticity
Data: Inside Airbnb, Sydney, snapshot of 16 June 2026; 12,419 listings
Is OLS biased? Are usual standard errors valid?
OLS is still unbiased: unbiasedness needs the error to have a mean of 0 given X, and heteroskedasticity is about its variance
The usual standard error formula assumes the same error variance for every observation
With heteroskedasticity, the usual standard errors are biased, so the t-statistics, p-values, and confidence intervals based on them are invalid
Robust standard errors: 1 change to fit()
model = ols("price ~ bedrooms", data=airbnb).fit()
robust = ols("price ~ bedrooms", data=airbnb).fit(cov_type="HC3")
| Coefficient on bedrooms |
155.01 |
155.01 |
| Standard error |
1.85 |
3.66 |
| 95% confidence interval |
151.4 to 158.6 |
147.8 to 162.2 |
Data: Inside Airbnb, Sydney, snapshot of 16 June 2026; 12,419 listings
Robust standard errors are a safe default
If the errors are homoskedastic, then usual and robust standard errors are both valid (robust ones in large samples)
If the errors are heteroskedastic, then only robust standard errors are valid, and only in large samples
Always plot residuals against fitted values
A curved pattern: try a log or a square of X, then run RESET again
Residual variance that differs across fitted values: report robust standard errors
No pattern: no evidence of either problem
Next week: measurement error